837 charts | Updates

Use these charts
Filter:
Log in to filter and search charts
Monday 15 September 2025
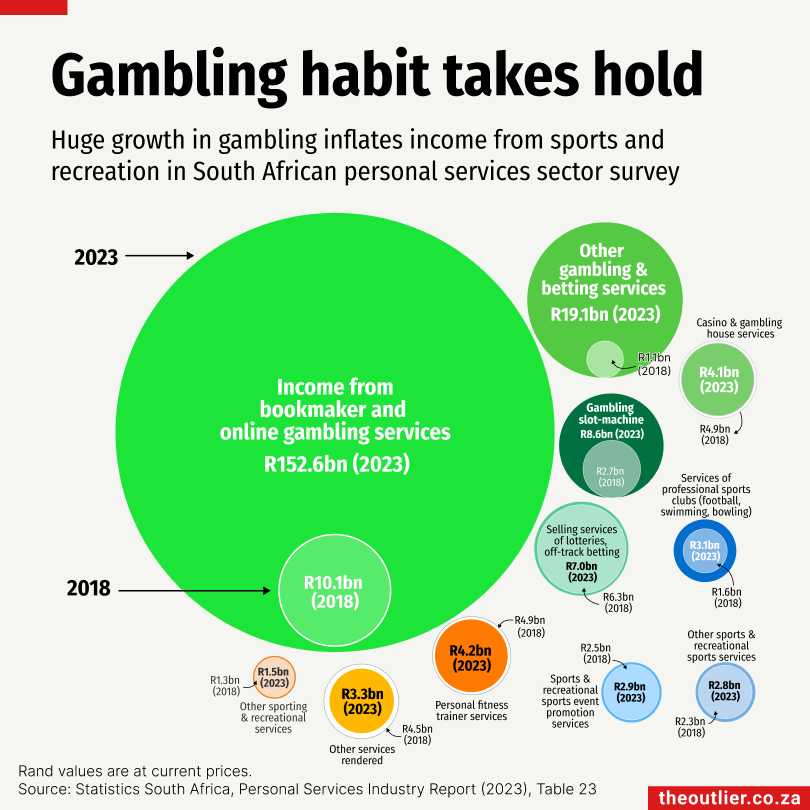
Statistics South Africa’s latest survey on the personal services industry shows a disturbing trend: the extraordinary growth in income from gambling services.The personal services industry includes the education, health, entertainment and recreation sectors. Five years ago, in 2018, services in health and education generated about 70% of the income in the personal services industry. That decreased to 56% in 2023.The results of the latest survey, conducted in 2023, show that recreational, cultural and sporting activities (the category that includes betting and gambling services) generated 37% of the total income generated by the personal services industry, which was estimated at R688-billion.The bubbles in the chart above show the services in the sporting and other recreational activities category only (ie, not cultural). The total income for this category is estimated at R209-billion in 2023. The gambling and betting services, which are in shades of green, grew from a combined income of R25-billion in 2018 to R191-billion in 2023.
Monday 8 September 2025
The payments space in South Africa is particularly dynamic at the moment. On 13 August 2025, Nedbank announced the purchase of iKhokha for R1.65-billion. And on 27 June 2025, Lesaka Technologies, which owns Kazang, announced the purchase of Bank Zero for R1.1-billion.
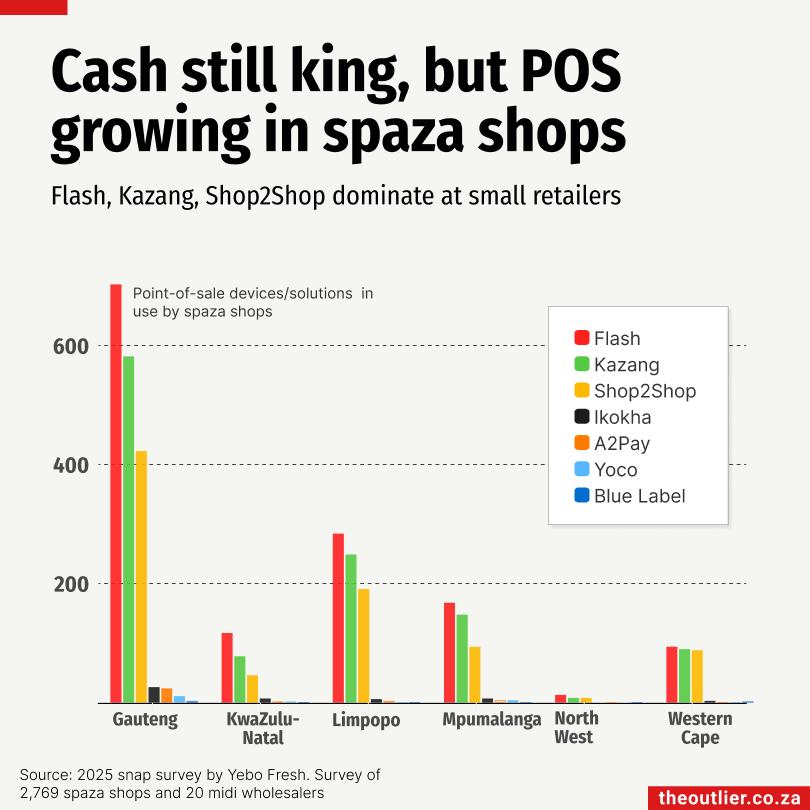
Most of this activity is being driven by an interest in the previously unbanked sector and particularly the small and medium-sized spaza shop networks.
A recent snap survey of spaza shop operators by Yebo Fresh found that while cash is still king, most operators are now using one or more point-of-sale devices. The research focused on 2,769 spazas and 20 midi wholesalers. The midi wholesalers mostly supply the spaza shops.
The larger businesses tended to use more devices while smaller shops used fewer. Average usage ranged between 1.4 and 2.1 devices per shop.
The most dominant systems are Flash, Kazang, and Shop2Shop. Shop2Shop was used universally in midis. Other solutions include Blue Label, Yoco, Ikokha, and A2Pay.
Regional trends show Flash dominating across provinces, with more shops surveyed in Gauteng, but the Western Cape was found to have the highest average number of devices per shop.
Monday 8 September 2025
Postbank, once championed as a no-fee banking alternative for social grant recipients, has lost about 75% of its social grant customers over the past five years.
After the South African Social Security Agency (SASSA) ended its unlawful contract with Cash Paymaster Services for the payment of social grants in 2018, the South African Post Office (SAPO) took over.
Postbank, a subsidiary of SAPO, stepped in to administer payments to newly issued SASSA-branded bank cards, which provided social grant beneficiaries with a no-fee alternative to private banks.
From at least 2022 onwards, customers experienced periodic payment delays due to cyber attacks and other technical problems.
Postbank was issued notices by the SA Reserve Bank in 2021, 2022, and 2023 to replace all SASSA Gold Cards with new Black Cards that have improved security features.
But it was only in 2024 that a concerted campaign started to swap Gold Card users to the new cards by March this year.
This caused chaos across the country as millions of people rushed to switch their cards. The process was slow and marred with difficulties.
SASSA has terminated its Master Service Agreement with Postbank, which will come to an end on 30 September 2025.
- Produced by The Outlier in partnership with GroundUp.
Monday 8 September 2025
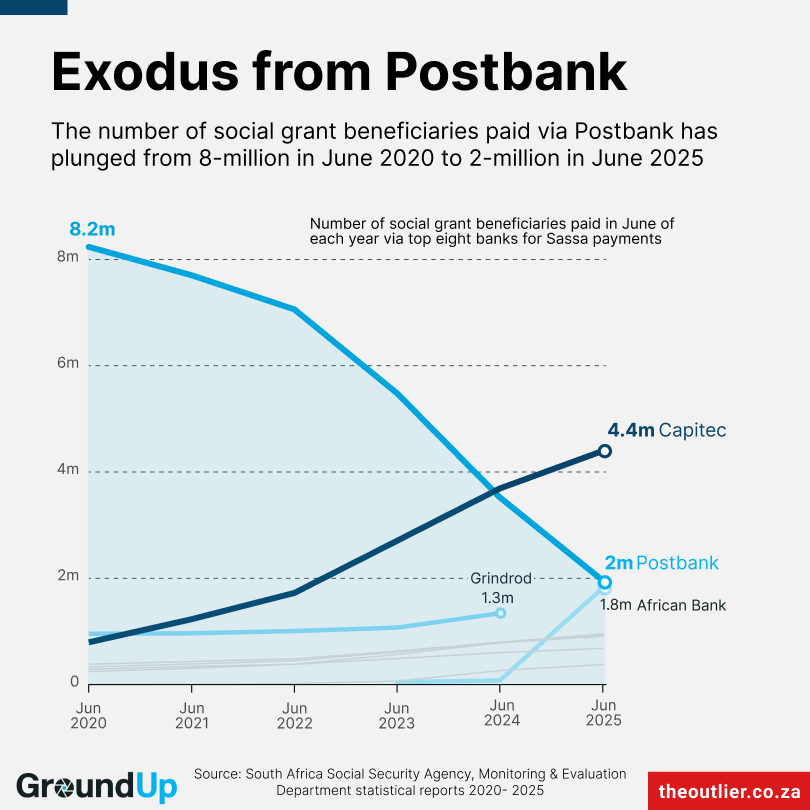
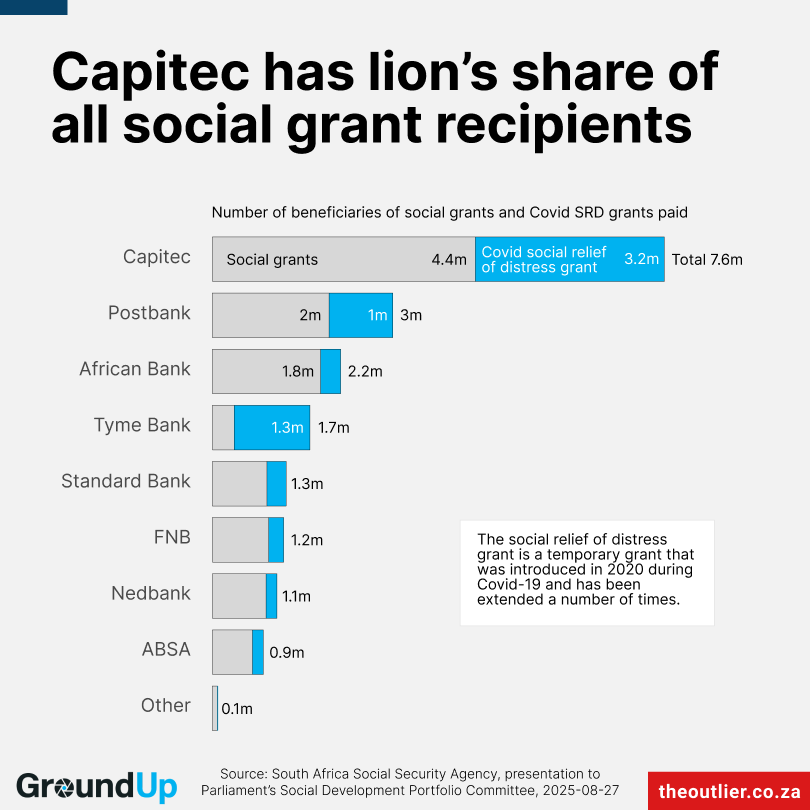
Postbank, once championed as a no-fee banking option for social grant recipients, has lost about 75% of its grant customers in the past five years. The number of beneficiaries paid through Postbank plunged to 3-million in June 2025, as payment delays, technical glitches and cyberattacks drove millions away.
As Postbank faltered, Capitec surged. In June 2025, 7.6-million people collected their grants through Capitec, 40% of the 19-million recipients that month. According to SASSA, 12-million received permanent social grants (such as child support, old-age, or disability), while 7-million received the social relief of distress grant, a temporary grant introduced during the Covid-19 pandemic in 2020 and repeatedly extended.
As Postbank faltered, Capitec surged. In June 2025, 7.6-million people collected their grants through Capitec, 40% of the 19-million recipients that month. According to SASSA, 12-million received permanent social grants (such as child support, old-age, or disability), while 7-million received the social relief of distress grant, a temporary grant introduced during the Covid-19 pandemic in 2020 and repeatedly extended.
- Produced by The Outlier in partnership with GroundUp.

Monday 8 September 2025
Johannesburg is leaking water. In its latest annual report (which covers the 2023/24 financial year), Johannesburg Water, the city’s water and sanitation utility, revealed there were 402 pipe bursts for every 100km of pipe – or roughly one burst every 250 metres.
It’s the city’s second-worst year for pipe bursts in a decade. The culprit? Ageing infrastructure.
Those bursts come at a high price. The city lost R2.1-billion worth of water to leaks and bursts in 2023/24 alone.
Johannesburg Water is replacing pipes, but progress is slow. Only 17km of pipes were replaced last year and 19km in 2022/23. This is a sharp drop from the 100km replaced in 2021/22.
- Produced by The Outlier in partnership with Our City News.

Monday 1 September 2025
Over half a million people in South Africa fell victim to consumer fraud in the past year. It is a sharp rise from 385,000 in 2019/20, according to Statistics South Africa’s 2024/25 Governance, Public Safety and Justice Survey. Women make up just over half of the victims.
Consumer fraud refers to being cheated on the quality or quantity of goods or services, and includes scams such as R99 debit orders, 419 schemes, and dubious online shopping deals.
Yet only one in three victims reported the crime to the police. Others turned to different authorities (32%) or tried to resolve it themselves (31%).
Monday 1 September 2025
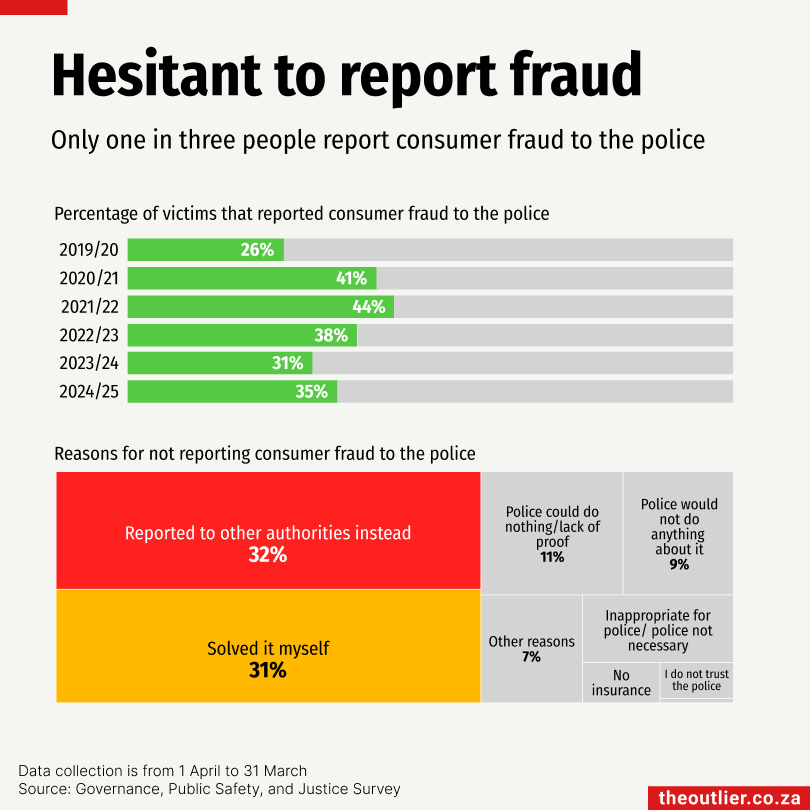
People are hesitant to report consumer fraud to the police, according to Statistics South Africa’s 2024/25 Governance, Public Safety and Justice Survey.
Over half a million people in South Africa fell victim to consumer fraud in the past year. That is a sharp rise from 385,000 in 2019/20.
But only one in three people reported these crimes to the police in 2024/25. It’s a decrease from the 44% who reported fraud in 2021/22.
Consumer fraud refers to being cheated on the quality or quantity of goods or services, and includes scams such as R99 debit orders, 419 schemes, and dubious online shopping deals.
Instead of reporting to the police, people have turned to different authorities (32%) or attempted to resolve the issue themselves (31%).
Monday 1 September 2025
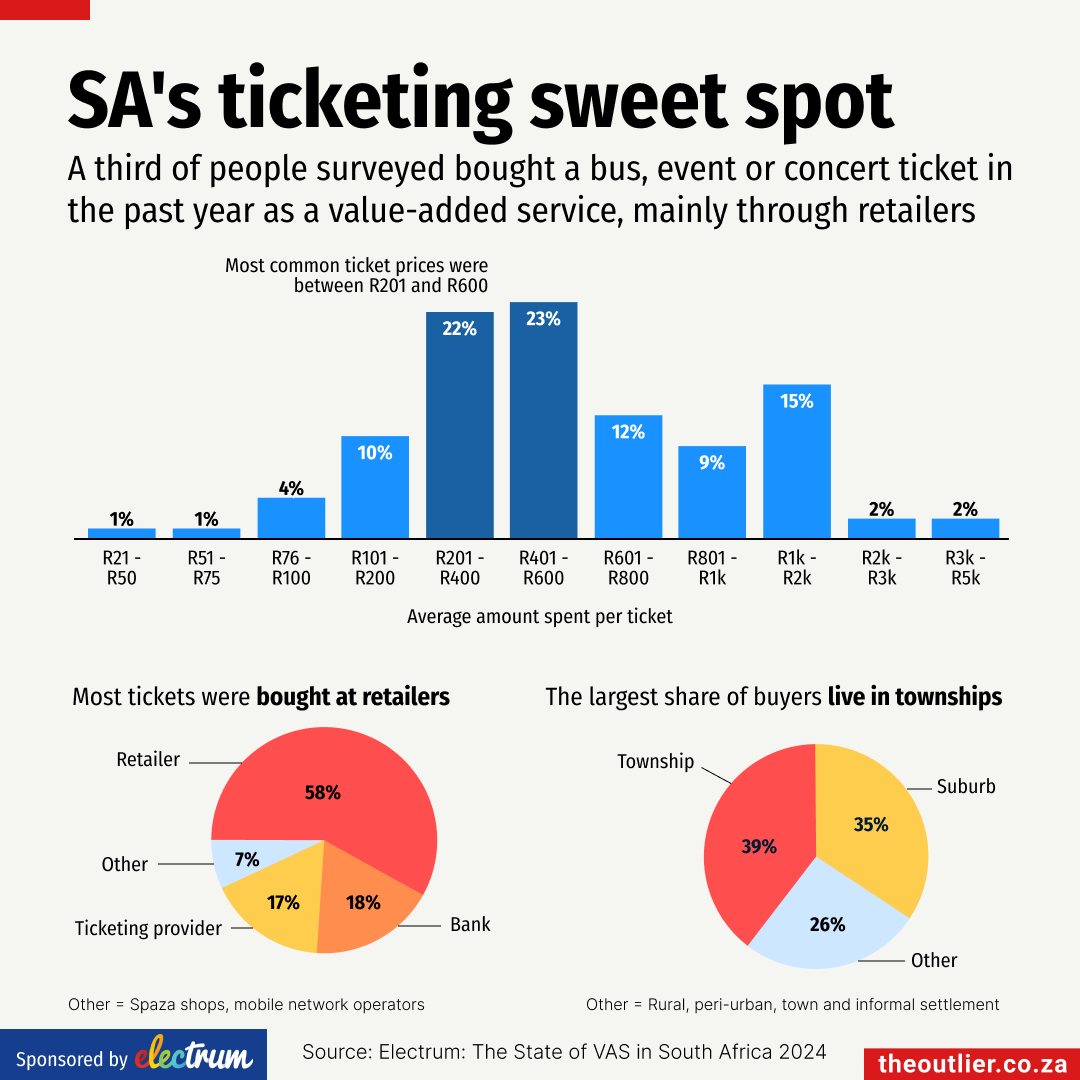
Ticketing is one of the value-added services that has shown the highest growth in usage by South Africans between 2022 and 2024, providing a significant opportunity to both banks and retailers offering this value-added service (VAS).
Interestingly, recent consumer research has shown that only 18% of tickets were bought through banks, compared to an overwhelming 58% of purchases being made in-store at retailers.
This can be attributed to the finding that 40% of buyers live in townships, where access to retailers and merchants makes it more convenient to purchase this VAS in-store than at a bank or via digital channels.
Electrum Software conducted research into how South Africans purchase value-added services such as prepaid airtime and data, prepaid electricity, and betting vouchers in November last year. Fieldwork took place across all nine provinces, in both urban and peri-urban areas.
- Electrum is the next-generation payments software company, powering payments for banks and retailers.

Monday 1 September 2025
Africa’s solar surge is gaining momentum. The number of countries importing solar panels from China has climbed over the past year, according to a new Ember report, appropriately titled The first evidence of a take-off in solar in Africa.
The report found that 20 African countries set new records for solar panel imports in the 12 months to June 2025. Algeria stood out, importing 33 times more panels than the previous year, making it the second-largest African importer in the first seven months of 2025. The country is pushing to accelerate its renewable energy transition, with a target of 4GW of solar capacity by the end of 2025.
South Africa remains the continent’s largest importer, with imports peaking in 2023 during the height of the country’s energy crisis.
Monday 1 September 2025
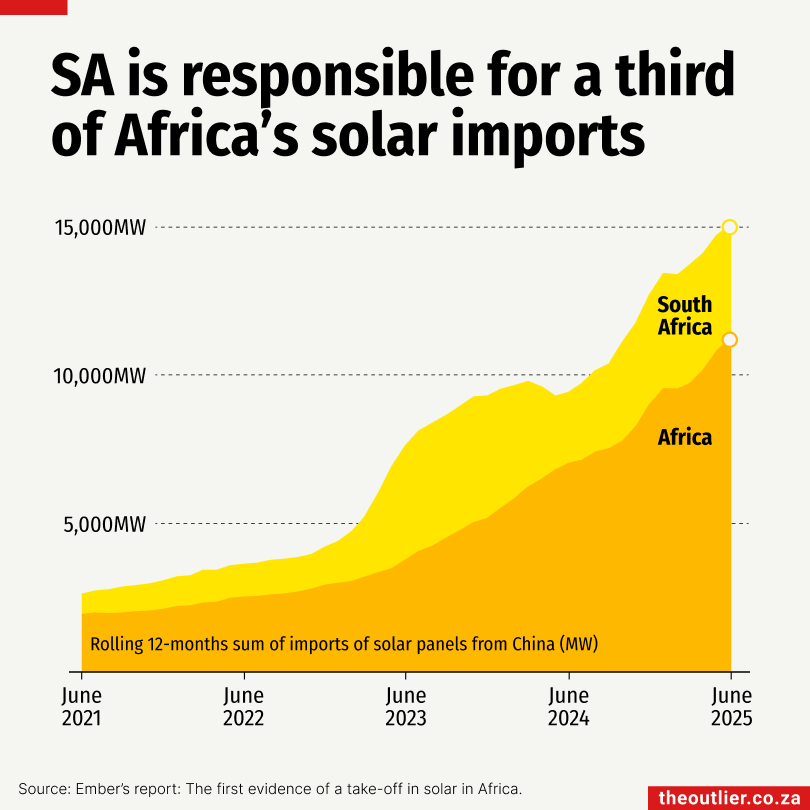
Africa is importing more solar panels than ever before, with the number of countries sourcing panels from China climbing in the past year, according to a new Ember report, The first evidence of a take-off in solar in Africa.
The report found that 20 African countries set new records for solar panel imports in the 12 months to June 2025. Overall, South Africa remains the continent’s largest importer, accounting for a third of solar panels shipped from China to Africa since 2021. Its imports peaked in 2023 during the height of the country’s energy crisis.
China, which manufactures 80% of the world’s solar panels, remains Africa’s main supplier. “Africa depends heavily on imports because domestic solar panel manufacturing is still limited,” the report noted. But Morocco has scaled up production to 1GW a year, while South Africa has reached a similar capacity. It’s a sign that local industries are beginning to take root.

Monday 1 September 2025
While almost all people who live in formal housing have access to water supply infrastructure, for many, the supply is not reliable.
According to the Department of Water and Sanitation, about 88% of people in South Africa who live in formal housing (at least RDP level or above) have access to water infrastructure, but only 67% have a reliable supply.
Water infrastructure access means it is available within 200m of a house. For the approximately 7.6-million people living in housing below RDP level, the situation is much worse: only 12% have access to water infrastructure.
This demonstrates how water and sanitation infrastructure are failing across the country. Water supply systems are not proactively maintained due to budgetary constraints and government mismanagement.
In most provinces – Gauteng, KwaZulu-Natal, North West, Free State, Northern Cape and Mpumalanga – the situation has gotten worse in recent years. In others, there has been some slow improvement.
The department’s data is based on the 2011 census and its own modelling. The figures should be treated as estimates.
- Produced by The Outlier in partnership with GroundUp.
Sunday 24 August 2025
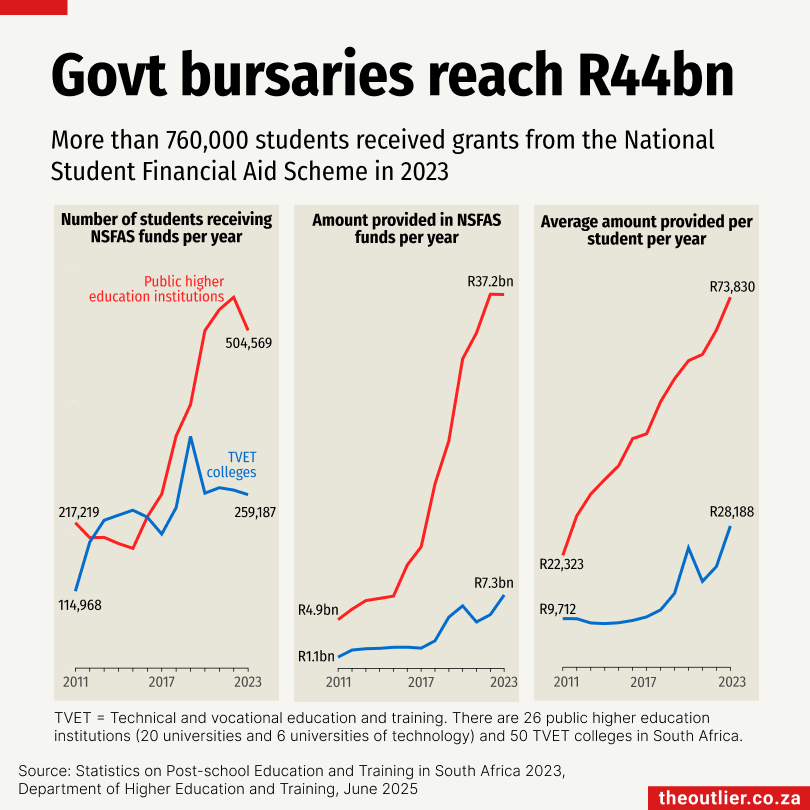
The National Student Financial Aid Scheme (NSFAS) has provided funds to thousands of students from poor and working-class families, so they get an opportunity to study at one of South Africa’s 26 public universities or 50 technical and vocational education and training colleges (TVET colleges).
In 2023 alone, more than 760,000 people received NSFAS funding, 500,000 of them women. NSFAS paid out R44.6-billion in funds that year, most of it to university students.
Nearly half (47%) of the just over a million students enrolled at public universities in 2023 were receiving NSFAS funds, according to Department of Higher Education and Training statistics.
The average bursary for a university student was R73,830, compared with R28,188 for TVET college students.
Before 2018, NSFAS funding was mostly loans. But in December 2017, then president Jacob Zuma announced that the government would subsidise higher education for students from households with annual incomes of up to R350,000. Since 2018, funding has been in the form of bursaries.
Sunday 24 August 2025
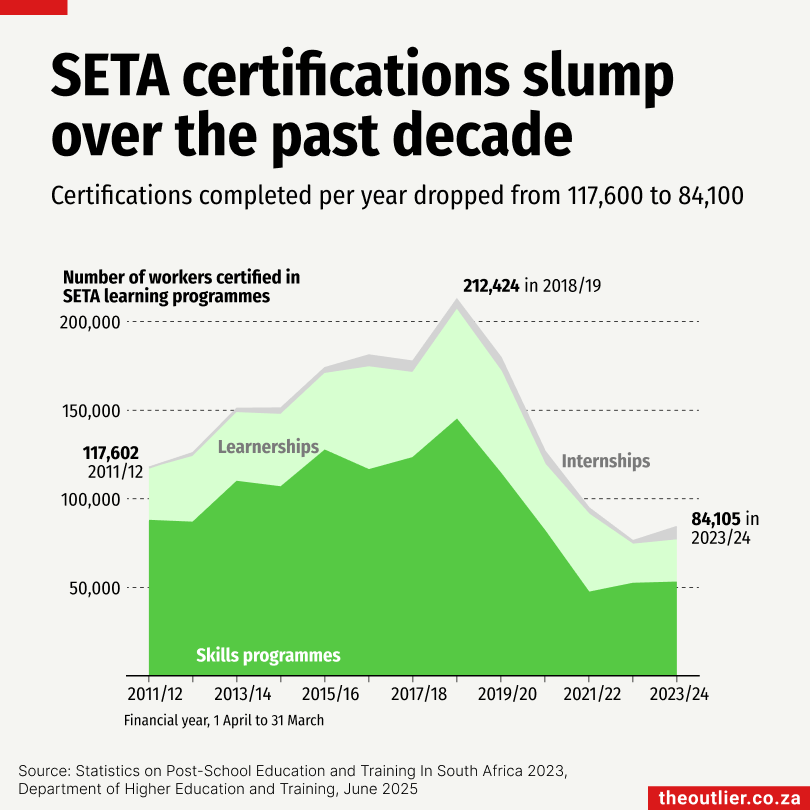
South Africa’s 21 Sector Education and Training Authorities (SETAs) are supposed to help workers gain new skills, grow their careers and boost productivity in sectors like agriculture, banking, energy, health, media, mining and transport, to name a few. Sounds good, right?
But the SETAs have long been plagued by inefficiency and red tape. A recent report by the Bureau for Economic Research notes that billions of rands collected for skills training are sitting idle rather than being put to use. That’s a serious problem when you consider South Africa’s youth unemployment crisis and skills shortage. SETAs should be part of the solution.
But the numbers tell a different story. Back in the 2011/12 financial year, about 135,000 people signed up for SETA learnerships, internships and skills programmes. Twelve years later, that figure had risen to about 149,000. Yet the number of people finishing their SETA programme and getting a certification has fallen from 117,600 to 84,100.

Sunday 24 August 2025
South Africa’s 21 Sector Education and Training Authorities (SETAs) are meant to help workers gain skills, grow careers and boost productivity across sectors from agriculture to mining. Sounds good, right?
But inefficiency and red tape have long dogged the system. It’s a major issue in a country battling youth unemployment and a critical skills shortage. Employers contribute 1% of their wage bill to the National Skills Development Levy, which raised R22.4-billion in 2023/24. Of this, nearly R18-billion went to SETAs, according to the Department of Higher Education and Training.
Government now says it will restructure the SETAs, tighten oversight and ensure they deliver real value. On 19 August 2025, Higher Education Minister Buti Manamela placed three SETAs under administration over governance failures and procurement irregularities.

Sunday 24 August 2025
If you’re an interpreter, writer, customer service rep, or data scientist, you may want to pay attention. A Microsoft Research study found these are among the jobs people consult AI tools about.
An analysis of 200,000 conversations with Microsoft Bing Copilot found that information gathering, writing, and communicating are the most common user goals for AI assistance. The study looked at three variables for jobs to predict how ‘applicable’ AI would be to replace these roles: coverage (how many of the tasks in a particular job could be done by AI), scope (how many hours of a work day could AI cover) and completion (how well could AI complete tasks) to come up with a composite score.
Unsurprisingly, jobs deemed the ‘most at risk’ by the study were those that entailed knowledge work or communication, which is very much the domain of large language models (LLMs). Jobs that involved more manual labour or a human touch scored very low on the replacement score.
Of course, the study has caveats: it examined a single LLM and only what users asked about. But that may be the point; these are exactly the tasks people are already turning to AI for.
Friday 22 August 2025
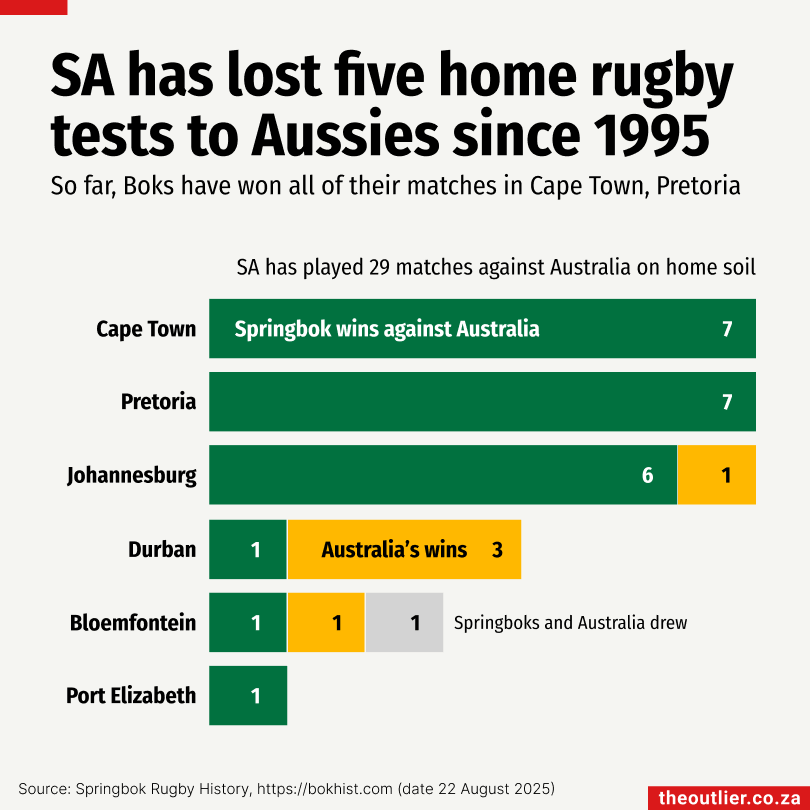
South Africa’s 16-point loss to Australia (22–38) on 16 August 2025 was one for the rugby history books – and not in a good way. You’d have to go back to 2008 in Durban, when the Aussies beat the Boks 27–15, to find another defeat by that kind of margin.
Since 1995, the Springboks and Wallabies have squared off 64 times. Twenty-nine of those games have been on South African turf, where the Boks usually own it, winning close to 80% of the time.
Some stadiums have been impenetrable fortresses: the Boks have never lost to Australia in Cape Town or Pretoria in the last 30 years. Last week’s clash at Ellis Park in Johannesburg marked the Wallabies’ first win there since 1995. Before that the Wallabies last beat the Boks at Ellis Park in 1963.
Durban, on the other hand, has never been the happiest hunting ground for South Africa. Against Australia, they’ve only managed one win in four matches.
Friday 22 August 2025
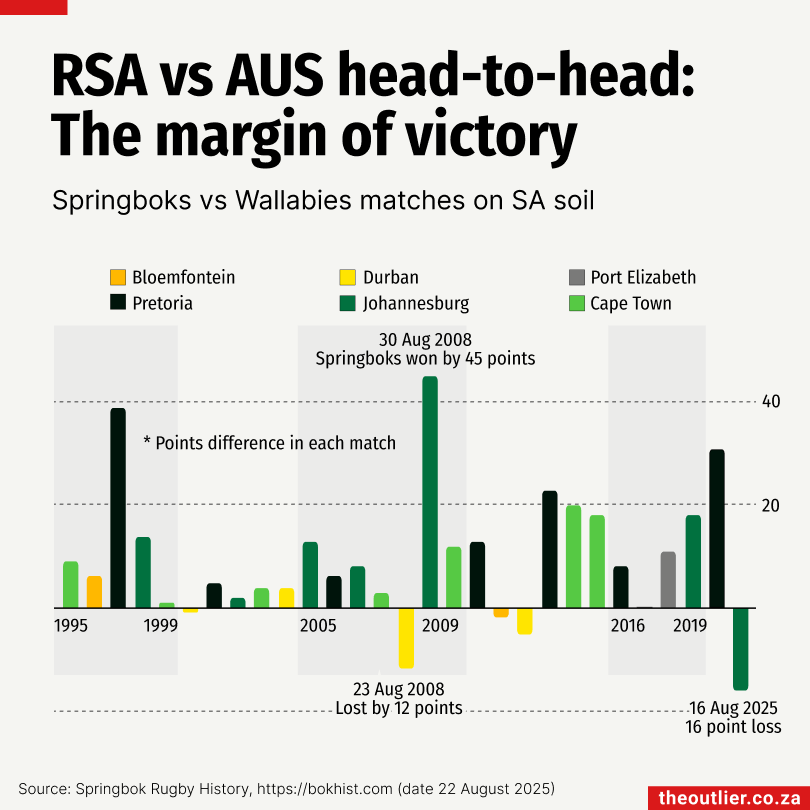
South Africa’s 16-point loss to Australia (22–38) on 16 August 2025 was one for the rugby history books – and not in a good way. You’d have to go back to 2008 in Durban, when the Aussies beat the Boks 27–15, to find another defeat by that kind of margin.
Since 1995, the Springboks and Wallabies have squared off 64 times. Twenty-nine of those games have been on South African turf, where the Boks usually own it, winning close to 80% of the time.
Some stadiums have been impenetrable fortresses: the Boks have never lost to Australia in Cape Town or Pretoria in the last 30 years. Last week’s clash at Ellis Park in Johannesburg marked the Wallabies’ first win there since 1995.
Durban, on the other hand, has never been the happiest hunting ground for South Africa. Against Australia, they’ve only managed one win in four matches.
Bloemfontein has been a mixed bag for the Boks. When the Boks faced the Australians there on 30 September 2017, they drew 27-27.
Monday 18 August 2025
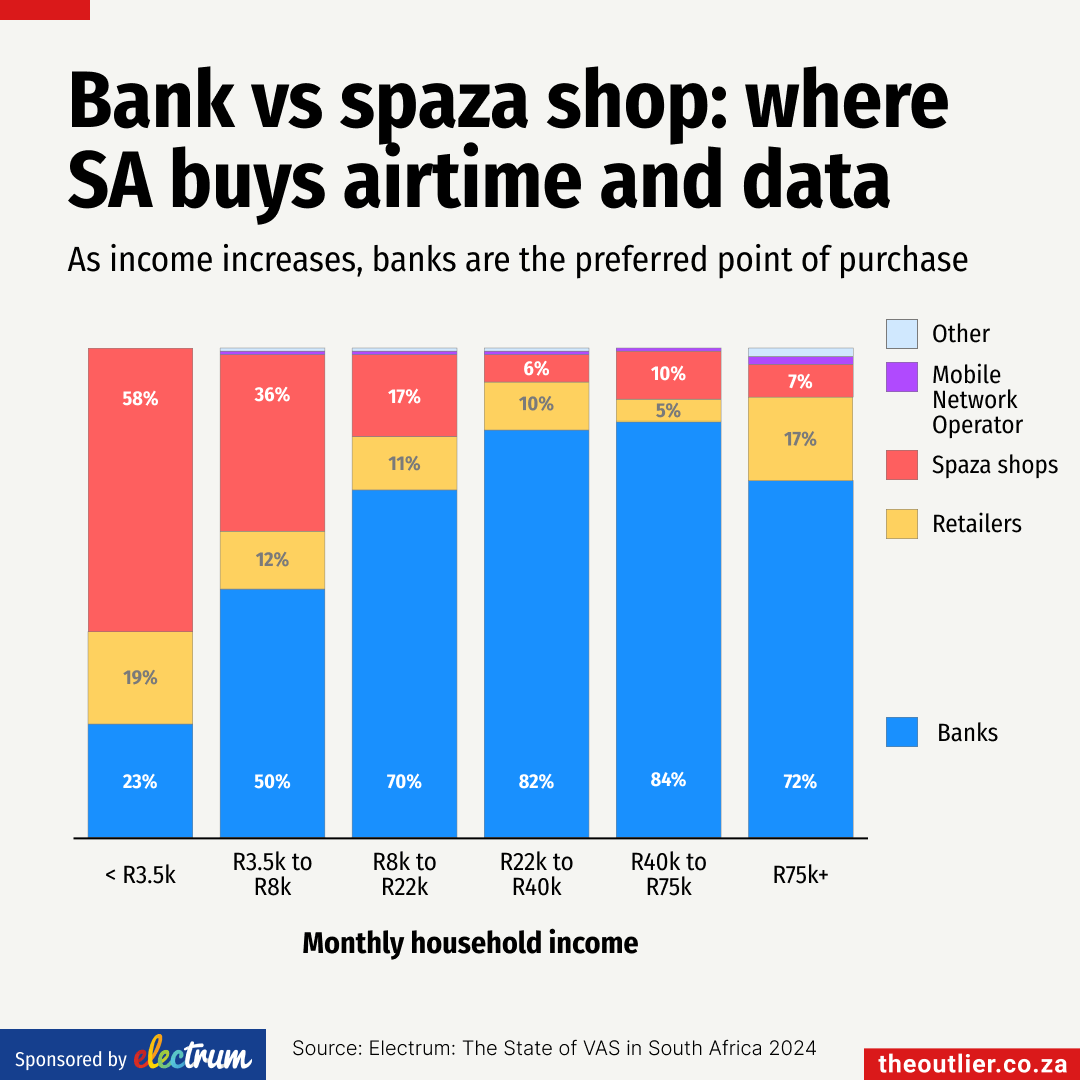
Prepaid airtime and data are the most used value-added services, with 95% of the South African population purchasing this VAS.
The majority of low-income households prefer to buy airtime and data through spaza shops.
This recent research into consumer behaviour by Electrum suggests that accessibility is a strong driver. Spaza shops have the highest daily transactions for airtime and data and they are more accessible in low-income areas than larger retailers.
In a country where mobile access is often the first and only digital touchpoint, prepaid airtime and data are no longer luxuries – they’re lifelines that support every level of human need.
The research into how South Africans purchase value-added services such as prepaid airtime and data, prepaid electricity, and betting vouchers took place in November last year. Fieldwork took place across all nine provinces, in both urban and peri-urban areas.
- Electrum is the next-generation payments software company, powering payments for banks and retailers.

Monday 18 August 2025
More than a million five- and six-year-olds walk to school. Nearly half (48%) walk for up to 15 minutes, and about 569,200 spend 15–30 minutes on foot. Another 78,500 walk for over half an hour, according to Statistics South Africa’s 2024 General Household Survey.
Nationally, the share of young children walking 30 minutes or more has dropped since 2010. But in Mpumalanga, it has more than doubled, from 5% in 2010 to 12% in 2023, according to a Department of Basic Education report.
For many in rural areas, these long walks remain a physically demanding and potentially unsafe part of the school day, especially where public transport is scarce and early learning centres are far from home.
Monday 18 August 2025
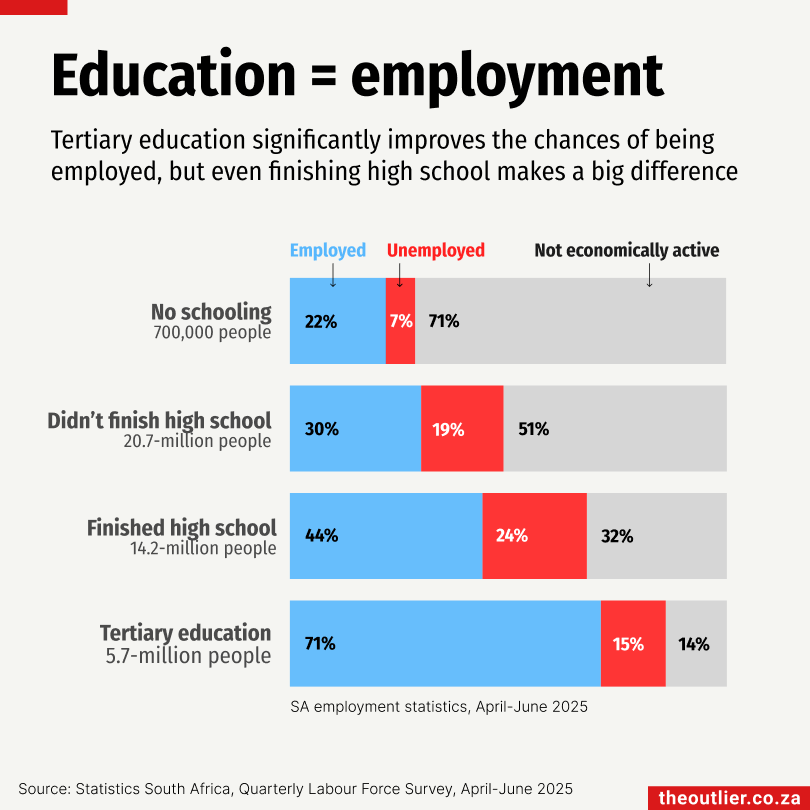
It’s a truism that education is the path to a good job. Parents save for years so their children can get a degree or qualification, giving them the best possible start. But when employment numbers are broken down by education level, the stark reality hits home.
According to Statistics South Africa’s Quarterly Labour Force Survey, people with tertiary education are most likely to be employed (71%), with only 15% unemployed and 14% classified as ‘not economically active’, meaning these are people who are unemployed and have not taken steps to look for work or to start a business in the four weeks before the survey was conducted.
For those without any schooling, the picture is reversed. Only 22% have jobs, while 71% are not economically active. Even finishing high school makes a significant difference: 44% of matriculants are employed. The data shows that education, especially beyond high school, greatly improves a person’s chances of finding work.

Monday 18 August 2025
There were 3.6-million new entrants to the job market among the unemployed in Statistics South Africa’s Quarterly Labour Force Survey for April to June this year. These are people who have never worked before but are currently looking for jobs, most of them likely young and searching for their first opportunity.
As the population grows, more young people enter the labour market every year. But the share of new entrants among the unemployed has also risen, from 41% a decade ago to 43% today. That small percentage shift translates into a massive jump in numbers: from 1.9-million to 3.6-million. It’s a clear sign that South Africa is not creating enough entry-level jobs for people without work experience.
As the population grows, more young people enter the labour market every year. But the share of new entrants among the unemployed has also risen, from 41% a decade ago to 43% today. That small percentage shift translates into a massive jump in numbers: from 1.9-million to 3.6-million. It’s a clear sign that South Africa is not creating enough entry-level jobs for people without work experience.
Monday 18 August 2025
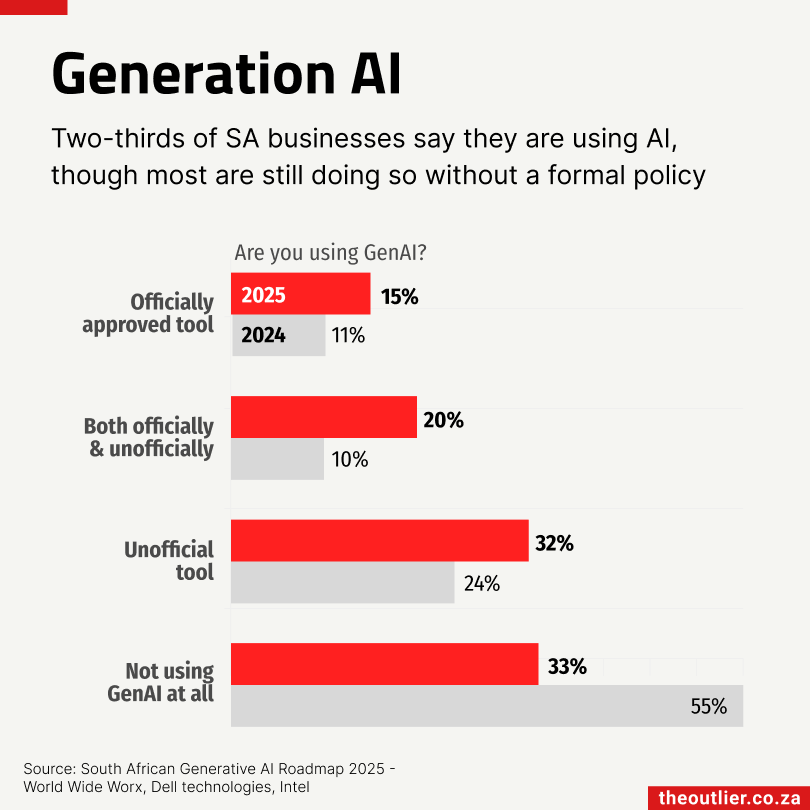
South African enterprises are integrating Generative AI (GenAI) into their operations fairly quickly, but most are doing so without formal strategies, says Arthur Goldstuck from World Wide Worx.
In the latest South African Generative AI Roadmap 2025, Goldstuck says that GenAI usage in large enterprises has increased from 45% in 2024 to 67% in 2025.
The GenAI report surveyed over 100 mid-sized and large enterprises across industry sectors.
From a benefit point of view, most users cited an increase in competitiveness (86%) as a reason for using AI, followed by improved productivity (83%) and enhanced customer service (66%).
But only 14% of the companies surveyed had a formal, company-wide GenAI strategy, according to the report.

Monday 11 August 2025
South Africa’s police service has more than 2,000 unfilled detective positions.
In a written response to Build One South Africa’s Mmusi Maimane, the minister of police, said that the Western Cape and KwaZulu-Natal were the worst off, reporting 902 and 639 vacancies, respectively.
The Eastern Cape was the only province where the number of filled detective posts exceeded the number funded, a rare surplus.
Without enough detectives, investigations stall, and justice is delayed. In March 2025, nearly half a million case dockets (499,873) were more than two years old, including 79,401 murder cases, according to a parliamentary response.
Adding to the problem is the fact that even when cases make it to court, only 12% result in a guilty verdict, according to criminologist Guy Lamb.
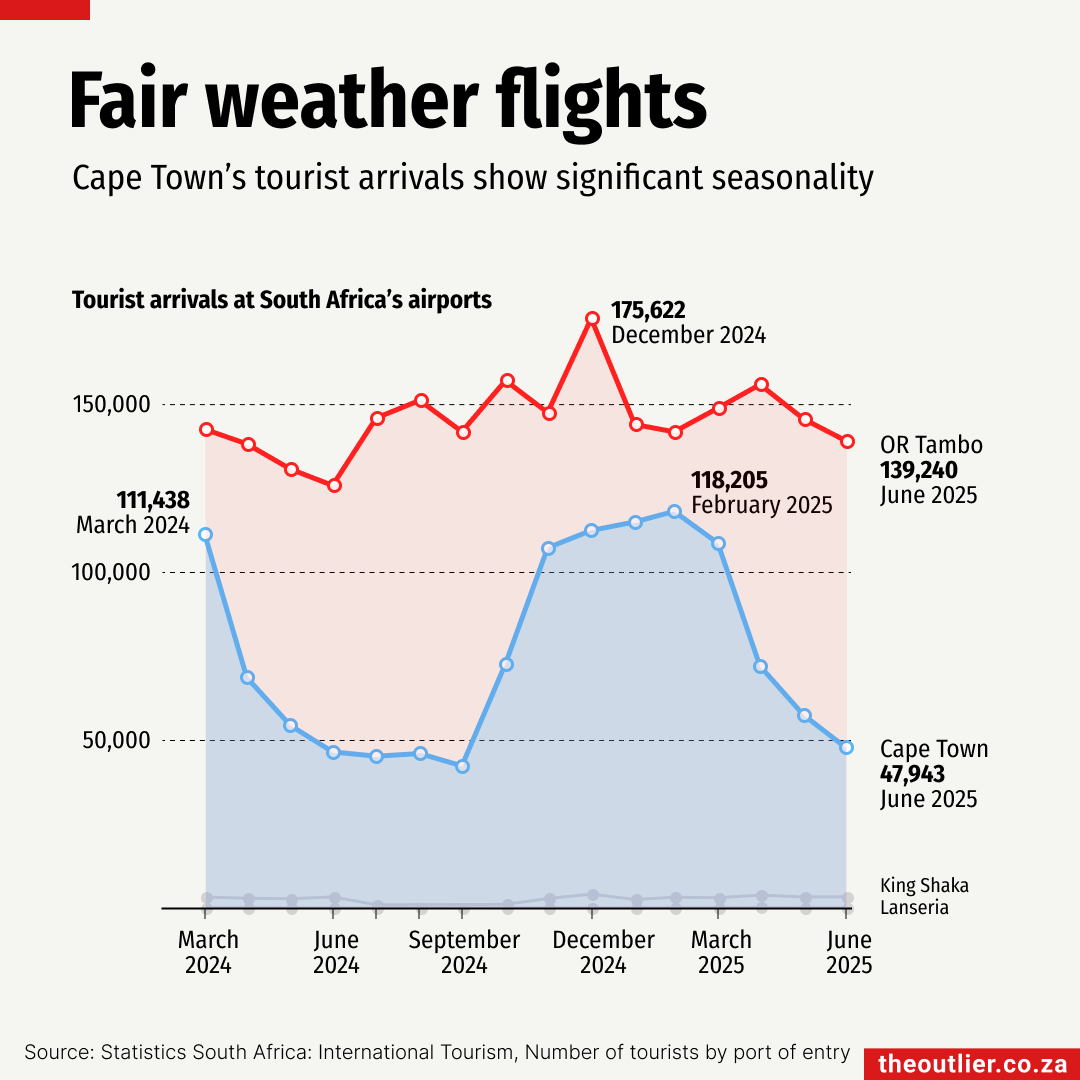
Monday 11 August 2025
Tourist arrivals at Cape Town International Airport show clear seasonal swings, peaking at 118,205 international visitors in February 2025 before dropping to 47,943 in June, according to Statistics South Africa. This trend reflects the city’s strong appeal during the southern hemisphere summer, from November to March, when warm weather and scenic coastlines draw tourists and airlines ramp up flight frequencies. Get the data used in the chart on DataDesk

Monday 11 August 2025
In Africa, only one in five of the sources quoted in the news is a woman, according to the most recent Who Makes the News?, Global Media Monitoring Project, a study done every five years.
South African media is better at quoting women than those in Kenya and Nigeria, but still, 75% of those quoted are men.
Quote This Woman+ is working to change this.
QW+ connects journalists from around the world with African women experts. This August, they’re running an #EachOneReachOne campaign to add 100 new experts to their database, which already contains more than 700 woman+ experts in fields ranging from gender rights, politics, economics and crime to AI, tech, education and climate change.
Help them reach that goal by nominating yourself or a woman+ whose expertise you know deserves to be heard.

Monday 11 August 2025
There are about 13-million vehicles on South Africa’s roads. Less than 1% of them are plug-in electric vehicles, said Hiten Parmar of non-profit Electric Mission in a webinar hosted by EE Publishers on 6 August 2025. That doesn’t sound particularly positive, but car sales data shows that South Africa is on the right track.
Sales of battery electric vehicles in South Africa have accelerated from just 160 in 2019 to 1,200 in 2024. Add plug-in hybrids, and the 2024 total approaches 2,000.
For South Africans, the cost of electric vehicles is a factor. That and anxiety about there being enough charging stations. Eighty to ninety percent of charging takes place at home, says Parmar. Plus, there are 385 charging stations in South Africa at present, according to Plugshare. So, that road trip from Jo’burg to Durban is doable; our highways are covered.

Monday 11 August 2025
Last year, about one in every five cars sold globally was an electric vehicle. Norway leads the charge, with 92% of new cars sold being electric. China is close to 50%, while the United States sits at 10%. In South Africa, it’s just three in every 500, a small share, but the trend is heading in the right direction.
Sales of battery electric vehicles in South Africa have accelerated from just 160 in 2019 to 1,200 in 2024. Add plug-in hybrids, and the 2024 total approaches 2,000.
Two big hurdles remain: price and concerns about charging infrastructure. Most charging, 80% to 90%, happens at home, says Hiten Parmar of non-profit Electric Mission in a webinar hosted by EE Publishers on 6 August 2025. Still, there are now 385 charging stations in South Africa, according to Plugshare, making road trips from Jo’burg to Durban feasible.

Monday 4 August 2025
South Africa failed to broker a last-minute deal to avoid the 30% trade tariff imposed by US President Donald Trump, which will come into effect on 7 August 2025. It is a development that has become a source of “great anxiety” for citrus growers in the Western and Northern Cape, according to the Citrus Growers’ Association of Southern Africa (CGA).
The two provinces export around 7-million 15kg cartons of citrus to the US each year. But rerouting that fruit is no simple task.
Diverting fruit to other markets could depress prices in those markets through oversupply, which would negatively impact the entire Southern African citrus industry, explained the CGA.
South Africa is the world’s second-largest exporter of citrus. In the 2024 season, more than 2-million tonnes of oranges, mandarins, grapefruits and lemons were shipped overseas. The two biggest markets are Europe (36%) and the Middle East (19%). North America, which includes the United States and Canada, takes 9% of the exports.

Monday 4 August 2025
Despite the state of municipal services, or lack of them, the chief executives of 13 Johannesburg municipal companies in charge of delivering them earn over a million rand a year, according to data from the City of Johannesburg Medium Term Budget 2025/26 to 2027/28.
The biggest annual package of R4.84-million goes to the chief executive of City Power – that’s without a bonus. The CEO of Pikitup’s R4.36-million package does include a ‘performance bonus’ of R536,000.
Johannesburg Water’s CEO has a package of R3.6-million. The Johannesburg Roads Agency’s CEO gets R3.5-million, despite both entities being blamed for the giant hole on Republic Road in Randburg, which marked its one-year birthday in July.
Both executives’ remuneration packages include ‘performance bonuses’: R218,000 for Johannesburg Water’s CEO and R191,000 for the JRA’s.
As the bucks get passed around, the hole just gets deeper.
Monday 4 August 2025
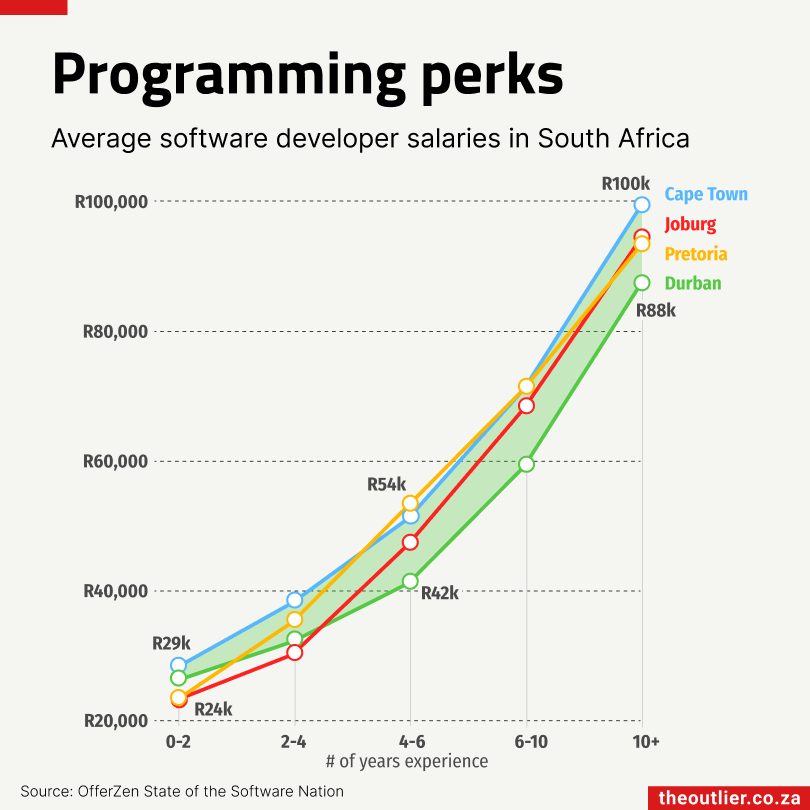
Cape Town developers continue to out-earn their peers in other parts of South Africa. According to the latest OfferZen State of the Software Nation report, experienced developers with more than ten years of experience in Cape Town earn about R100,000 per month. That’s roughly R12,000 more than their coastal counterparts in Durban, who earn around R88,000. In Johannesburg and Pretoria, senior developers earn similar amounts, R95,000 and R94,000, respectively.
Interestingly, Durban developers start strong, with entry-level salaries averaging R27,000 a month, only slightly behind Cape Town’s R29,000. But over time, Durban developers appear to fall behind their peers elsewhere in the country.
For mid-level developers (those with four to six years of experience), Pretoria offers the highest average salary at R54,000 per month, followed by Cape Town at R52,000 and Johannesburg at R48,000.
Monday 4 August 2025
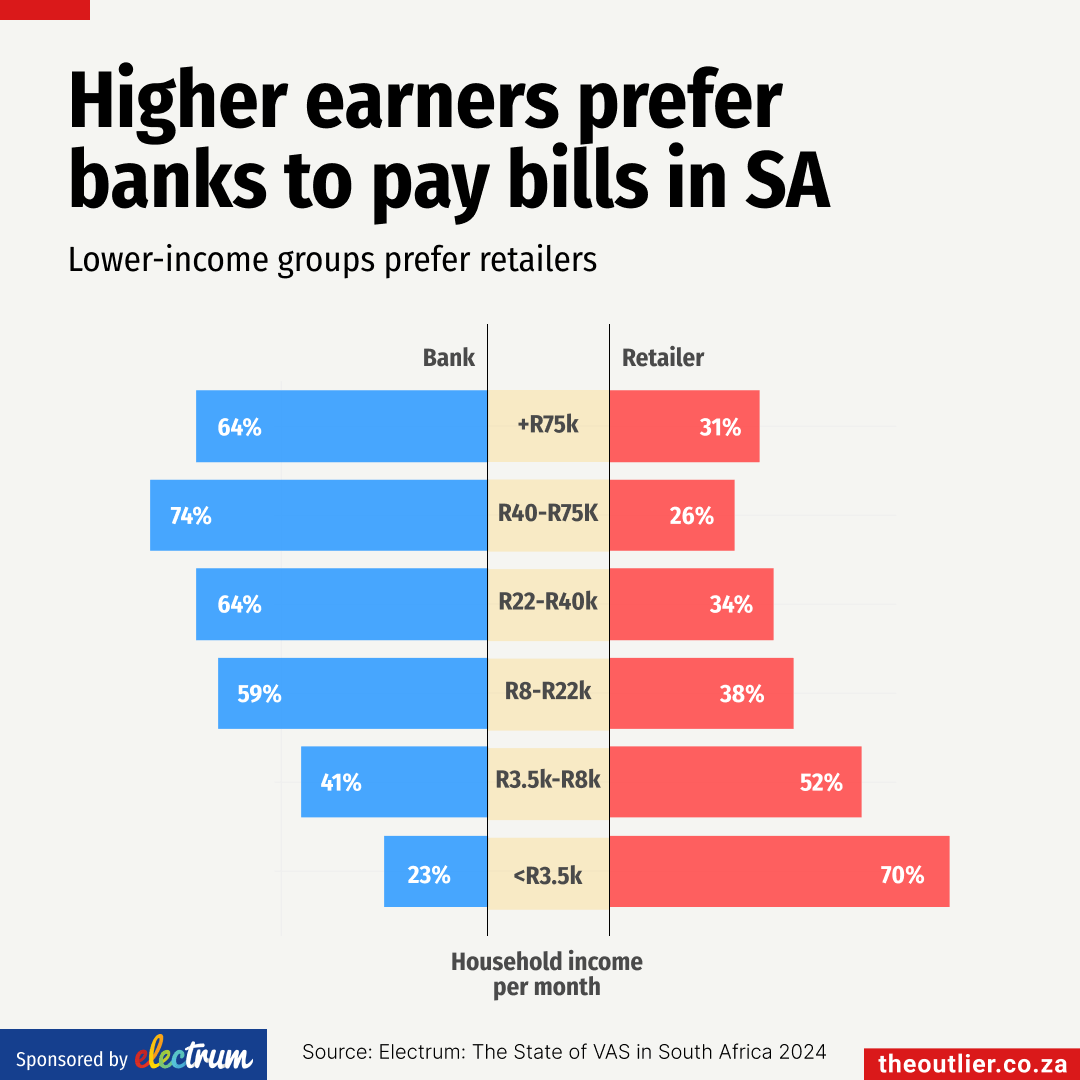
How much you earn can determine where you will pay your bills. Banks are a popular choice for households earning above R8,000 a month, according to recent survey research by Electrum Software. But if your household earns less than R8,000 a month, you’re more likely to pay your bills at a retailer.
Electrum found that different consumers pay their bills in ways that fit into their day-to-day lifestyles and budgets.
Their survey, conducted in November 2024, examined how South Africans purchase value-added services (VAS) such as prepaid airtime and data, prepaid electricity, and betting vouchers. With fieldwork taking place across all nine provinces, in both urban and peri-urban areas, Electrum says the findings highlight how VAS purchasing has become ingrained in everyday behaviour, with growth potential remaining for all businesses selling these services.
- Electrum is the next-generation payments software company, powering payments for banks and retailers.

Sunday 27 July 2025
More than 200 corruption probes by the Special Investigating Unit (SIU) have been authorised by South African presidents in the past 11 years.
The SIU’s job is to recover government losses from financial crime. When there are serious allegations of corruption, malpractice and maladministration in state institutions, the presidency can authorise the unit to investigate with a presidential proclamation.
The presidency has issued a total of 300 presidential proclamations since 2001 and 55% of those were by Cyril Ramaphosa since he became president in February 2018.
The 2024/2025 financial year was particularly prolific with 49 proclamations issued.
Get the data used in the chart on DataDesk

Sunday 27 July 2025
The Special Investigating Unit is “one of South Africa’s most effective anti-corruption agencies”, says the Institute for Security Studies (ISS) in a policy brief titled The future of South Africa’s Special Investigating Unit.
The unit’s job is to recover government losses from financial crime. When there are serious allegations of corruption, malpractice and maladministration in state institutions, the presidency can authorise the unit to investigate with a presidential proclamation.
How effective are these investigations? “It is difficult to measure the effectiveness of anti-corruption agencies, and reputation is often used as an indication of effectiveness,” says the ISS.
But one measurable metric is the value of cash and assets recovered. Over the past five years, the SIU has recovered nearly R5-billion in assets. Another R19.5-billion worth of contracts were set aside because of SIU investigations.
The 2023/24 financial year was particularly successful, with R2.3-billion in assets recovered, most of which were from two major investigations into Transnet and the National Student Financial Aid Scheme.
Get the data used in the chart on DataDesk
Sunday 27 July 2025
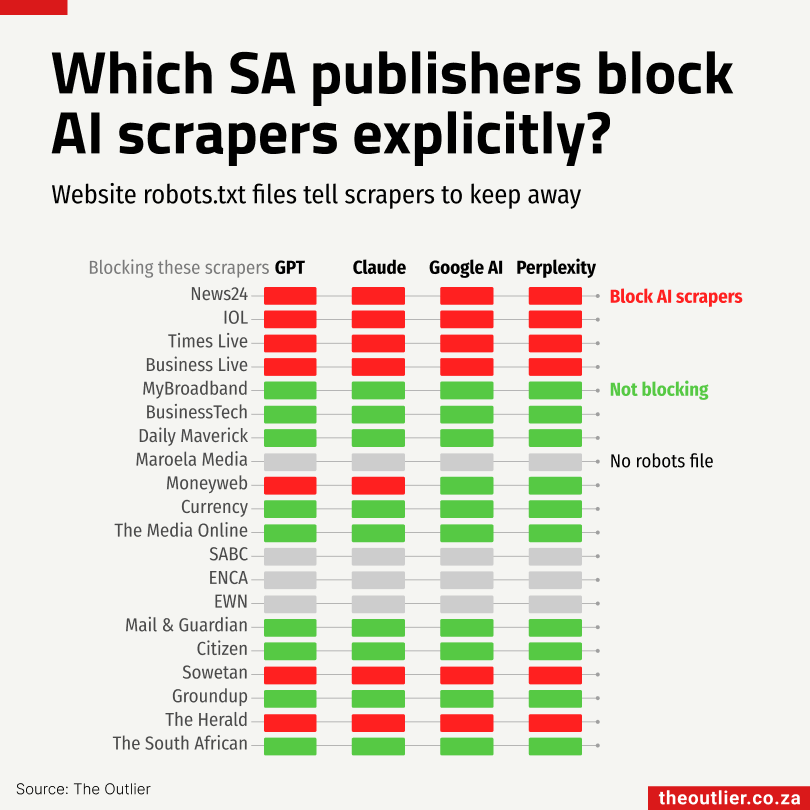
SA’s biggest news sites are blocking AI bots.
News24, IOL, and TimesLIVE, along with their sub-brands, have updated their robots.txt files to block scrapers from OpenAI, Google AI, Perplexity, and Claude. Most smaller publishers haven’t followed suit. Many don’t even have a robots.txt file at all.
So, what is robots.txt? It’s a small text file that tells bots and web crawlers which parts of a site they’re allowed to visit. But it’s not enforceable. It’s more of a polite request. Reputable bots usually listen. Others don’t.
Still, the presence (or absence) of AI-blocking rules in the file is telling. If a publisher hasn’t added them, it likely means AI scraping isn’t a major concern, or hasn’t been considered yet.
There are good reasons for concern. Publishers that invest heavily in original reporting have little incentive to let their work be scraped, paraphrased, and served up in chatbots, especially when that means fewer clicks, less traffic, and no attribution. The costs are real too: sites like Wikipedia have reported massive spikes in bandwidth usage from AI scraping bots.

Sunday 27 July 2025
Beef mince is at its highest price in eight years, according to Statistics South Africa’s Consumer Price Index. It was R14/kg more expensive in June than it was at the beginning of the year.
The increase is largely due to a widespread outbreak of foot-and-mouth disease (FMD), a highly contagious virus that affects cattle, which has caused supply shortages. Infected cattle have been quarantined, and animal movement has been restricted until herds are vaccinated. There have been 270 reported outbreaks of the disease across five provinces.
South Africa currently relies on Botswana to supply its FMD vaccines. The Botswana Vaccine Institute is one of just five FMD vaccine producers in Africa.
At the Foot-and-Mouth Disease Indaba on 21 July 2025, Agriculture Minister John Steenhuisen admitted that South Africa had been unprepared. “The national FMD vaccine bank was depleted,” he said.
“Onderstepoort Biological Products [a state-owned vaccine manufacturer] currently lacks the infrastructure to produce FMD vaccines at the scale and speed required to respond to outbreaks,” said Steenhuisen.
Sunday 27 July 2025
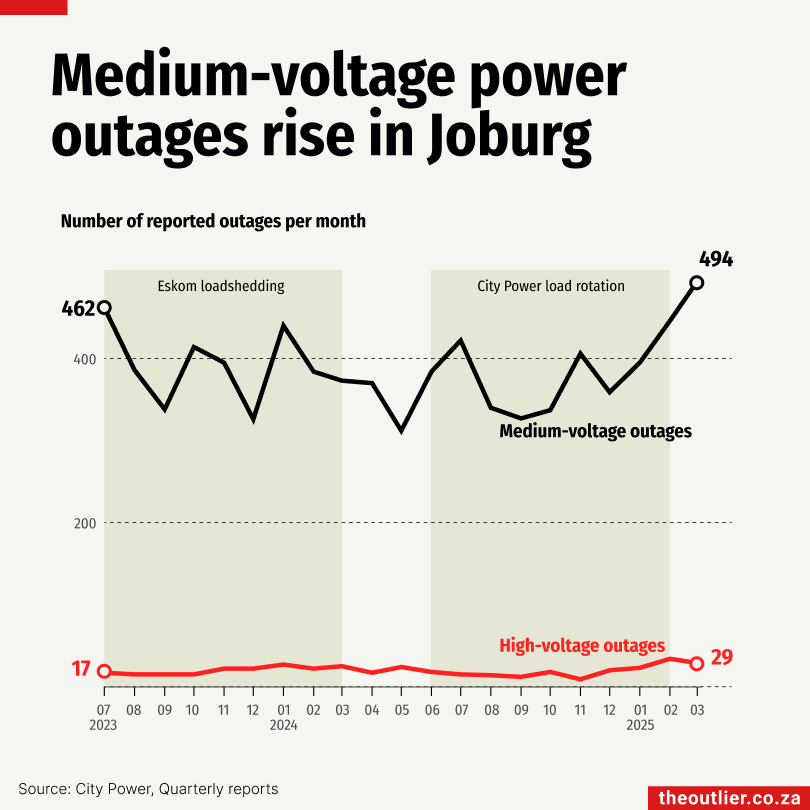
City Power customers endured months of power cuts, even after Eskom stopped loadshedding in March last year. But instead of “loadshedding,” it was called “load reduction.” That ended in Johannesburg in February this year, but power outages certainly haven’t.
City Power publishes data on reported power faults, and the numbers tell a worrying story.
The most serious faults, on high-voltage power lines, began rising toward the end of 2024. These outages affect large areas and are classified as “critical,” City Power says.
But the steady increase has been on the medium-voltage distribution network – the system that carries electricity from high-voltage lines to the low-voltage network that powers our homes. Medium-voltage outages usually hit an entire suburb or even multiple suburbs.
In March alone, 494 medium-voltage outages were reported.
City Power does provide real-time updates on the progress of repairs to high- and medium-voltage faults via its various public channels.
Get the data used in the chart on DataDesk
Sunday 27 July 2025
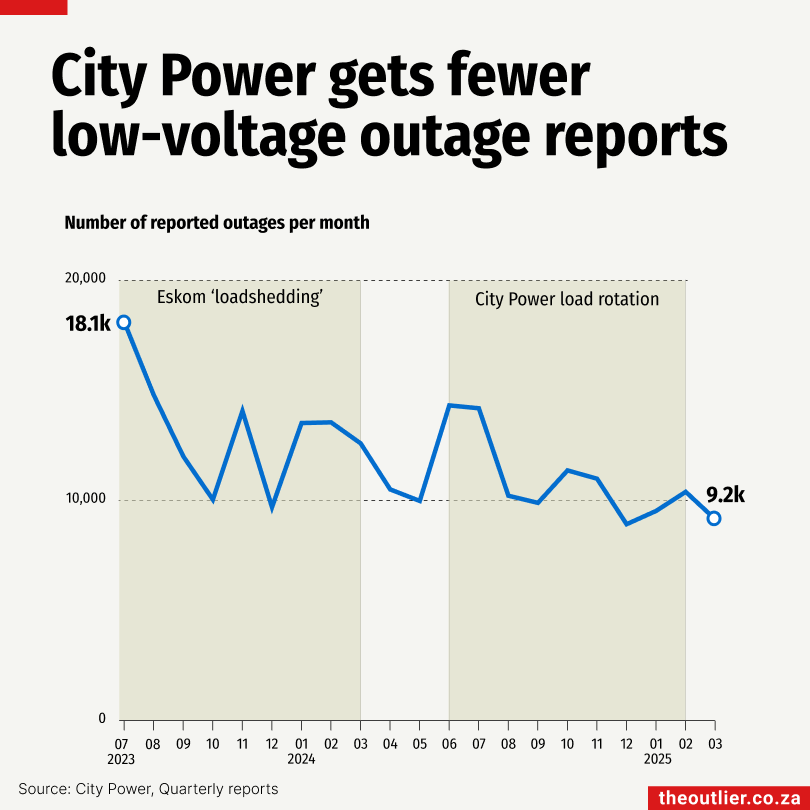
City Power customers endured months of power cuts, even after Eskom stopped loadshedding in March last year. But instead of “loadshedding,” it was called “load reduction.” That ended in Johannesburg in February this year, but power outages certainly haven’t.
City Power publishes data on its low-voltage outages, which tend to affect individual households or a few houses on a street or a block.
In March 2025, City Power received 9,200 outage reports, which sounds bad, but a year-and-a-half ago, in July 2023, the worst year of Eskom’s loadshedding, it received more than 18,000 outage reports. Low-voltage outage reports regularly top 10,000 a month.
The reported figures of low-voltage outages refer specifically to the number of logged outage calls, not the actual number of unique fault incidents on the electricity network, says City Power. “For instance, 300 calls from residents on the same street could all stem from one technical fault.”
Get the data used in the chart on DataDesk
Sunday 27 July 2025
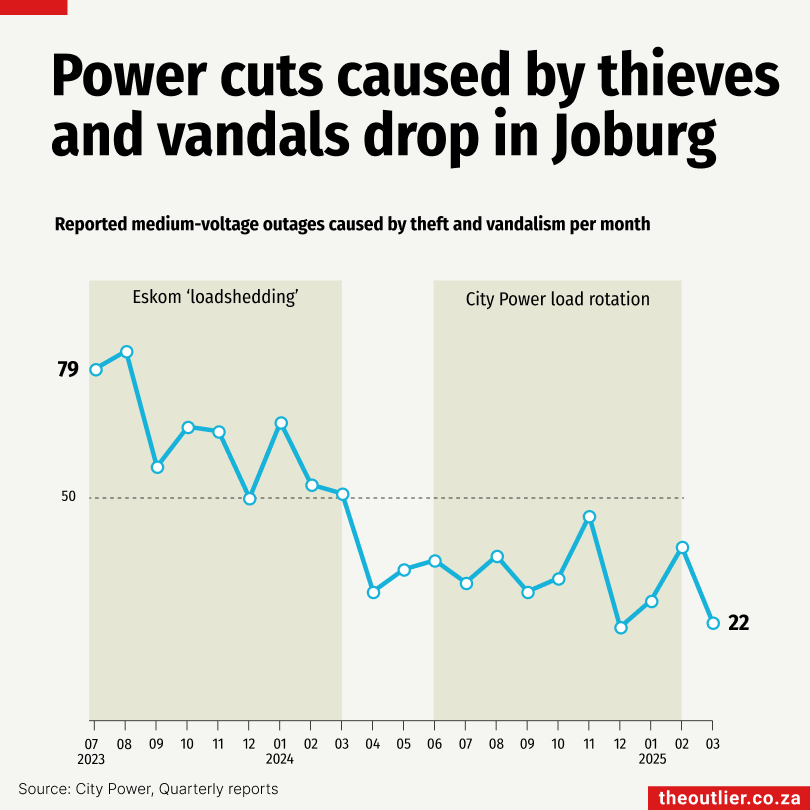
Equipment failure is behind roughly 60% of City Power’s medium-voltage outages, but it’s the outages caused by thieves and vandals that anger Johannesburg residents the most.
On the bright side, there has been a sharp drop in theft and vandalism-related outages on the medium-voltage network since Eskom’s loadshedding ended in March 2024. In the last six months of 2023, theft and vandalism were the cause of 17% of the outages, which dropped to 9% in the last six months of 2024. Only 4% of medium-voltage outages in March this year were caused by thieves and vandals.
A light at the end of that tunnel, perhaps?
But falling crime-related outages don’t explain why overall outages on the medium-voltage network are still rising, from 462 in July 2023 to 494 in March 2025.
Get the data used in the chart on DataDesk

Friday 25 July 2025
US President Donald Trump’s 30% tariff on South African imports has dealt a blow to the African Growth and Opportunity Act (AGOA), which is set to expire in September 2025. AGOA allows eligible sub-Saharan African countries duty-free access to the US market for thousands of products, aiming to boost economic growth through exports.
In 2024, South Africa accounted for nearly half ($3.8-billion) of the $7.9-billion in US imports under AGOA. The country’s top export under the agreement is transport equipment. That year, South Africa exported 24,681 vehicles to the United States, according to the Automotive Business Council (Naamsa).
“The US tariffs directly threaten thousands of jobs in our sector, disrupt hard-won industrial capabilities, and risk devastating communities such as East London, where the auto sector forms the economic heartbeat of the town,” said Naamsa CEO Mikel Mabasa. “If we cannot retain export markets like the US, we risk turning vibrant industrial hubs into ghost towns.”
South Africa’s automotive industry supports over 110,000 formal sector jobs, according to Naamsa.
Thursday 24 July 2025
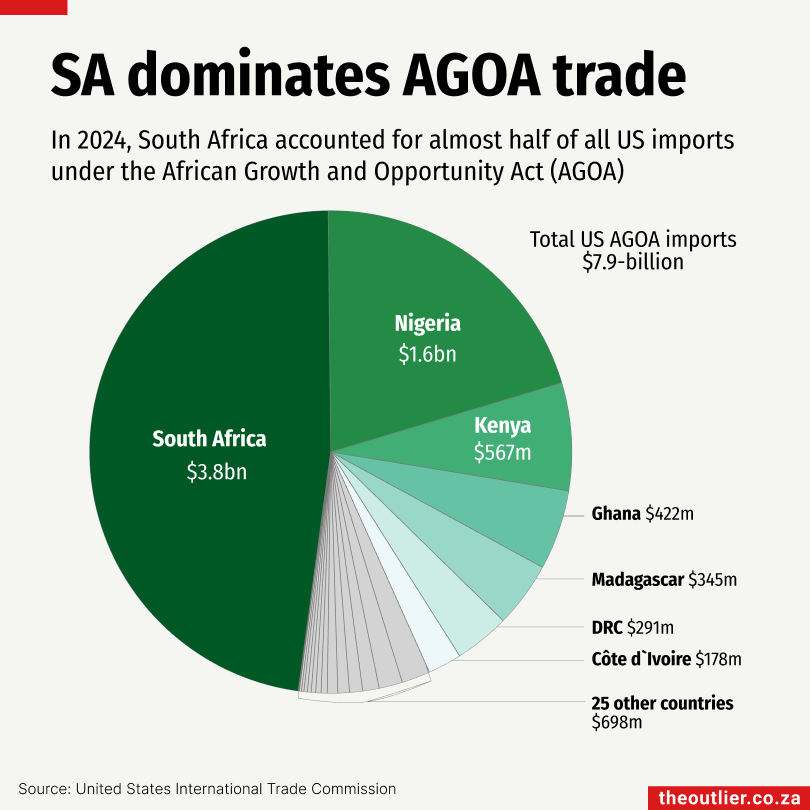
US President Donald Trump’s 30% tariff on South Africa has dealt a blow to the African Growth and Opportunity Act (AGOA), which is due to expire in September 2025. AGOA provides duty-free access to eligible sub-Saharan African countries for thousands of products, aimed at promoting economic growth through exports.
Thirty-two countries are eligible for AGOA.
In 2024, South Africa accounted for almost half ($3.8-billion) of the $7.9-billion in US imports under AGOA, followed by Nigeria ($1.6-billion) and Kenya ($567-million), according to US International Trade Commission data.
Nigeria mainly exports crude oil, while Kenya’s key exports are textiles.
Roughly 25% of South Africa’s total exports to the US fall under AGOA, according to a 2025 Parliamentary Budget Office report.
South Africa’s top AGOA export is transport equipment.
Wednesday 23 July 2025
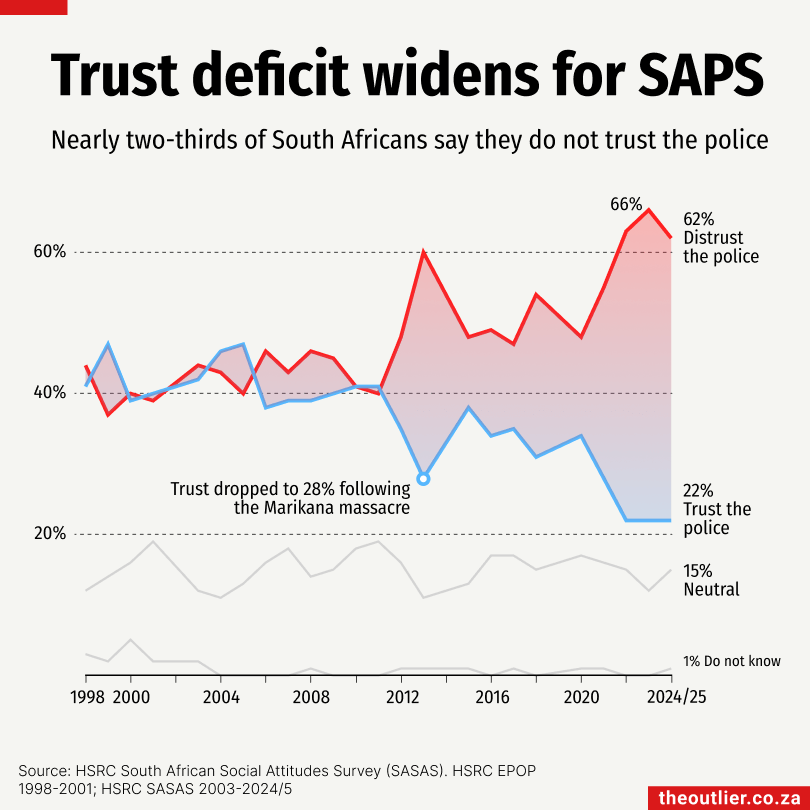
South Africans don’t trust the police. About one in five people surveyed by the Human Sciences Research Council (HSRC) earlier this year said they ‘trust’ or ‘strongly trust’ the police, but three in five said they ‘distrust’ the police.
Trust in the police has almost halved, from 41% of the people surveyed in 1998 to just 22% in 2024/25, according to an HSRC report, National and provincial trends: Trust in the police, 1998-2025.
The most recent survey results are the lowest recorded levels of trust in 27 years, said the HSRC.
The survey found that trust eroded when people felt they were treated unfairly or disrespected, or believed the police lacked impartiality, transparency, or effectiveness.
Why does this matter? The HSRC says, “The risk is that low and diminishing confidence in the police, if left unchecked, will also continue to negatively shape views of key elements of police legitimacy.”
Wednesday 23 July 2025
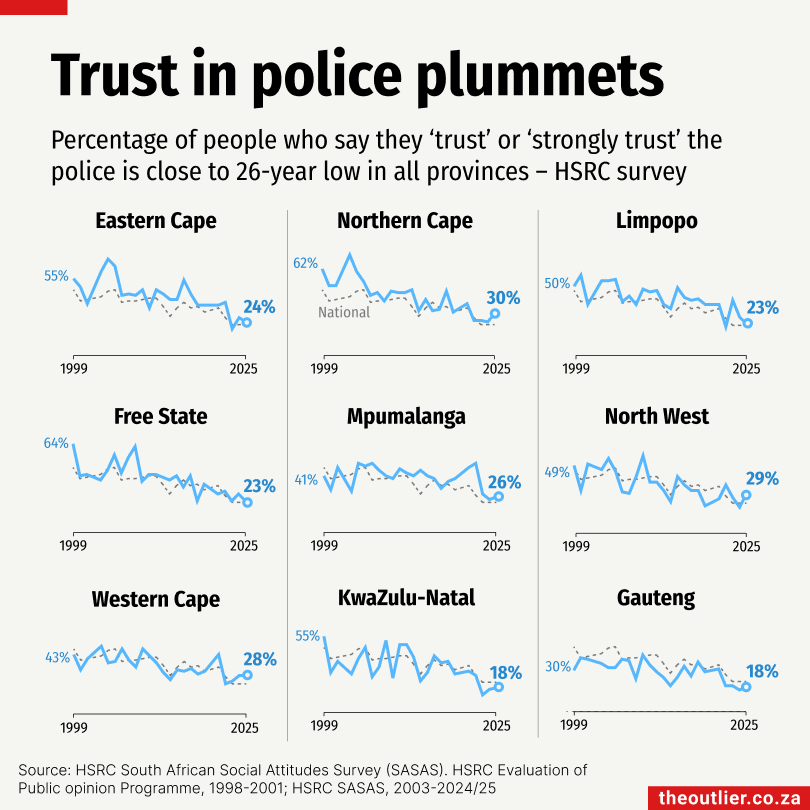
Trust in the police has dropped in every province of South Africa.
There was a time when more than 60% of people in the Northern Cape, Free State, and Eastern Cape said they trusted the police. But in a survey conducted in early 2025, not a single province recorded trust levels above 30%.
Nationally, trust in the police has nearly halved, from 41% in 1998 to just 22% in 2024/25, according to the Human Sciences Research Council (HSRC) report National and provincial trends: Trust in the police, 1998-2025.
“While provincial levels and trajectories have varied, the trend points to a deepening legitimacy crisis for SAPS across the country,” the HSRC says. “Historically higher-trust provinces are converging downward towards the levels of deep scepticism observed in Gauteng and KwaZulu-Natal.”
“The risk is that low and diminishing confidence in the police, if left unchecked, will also continue to negatively shape views of key elements of police legitimacy,” warns the HSRC.
Tuesday 22 July 2025
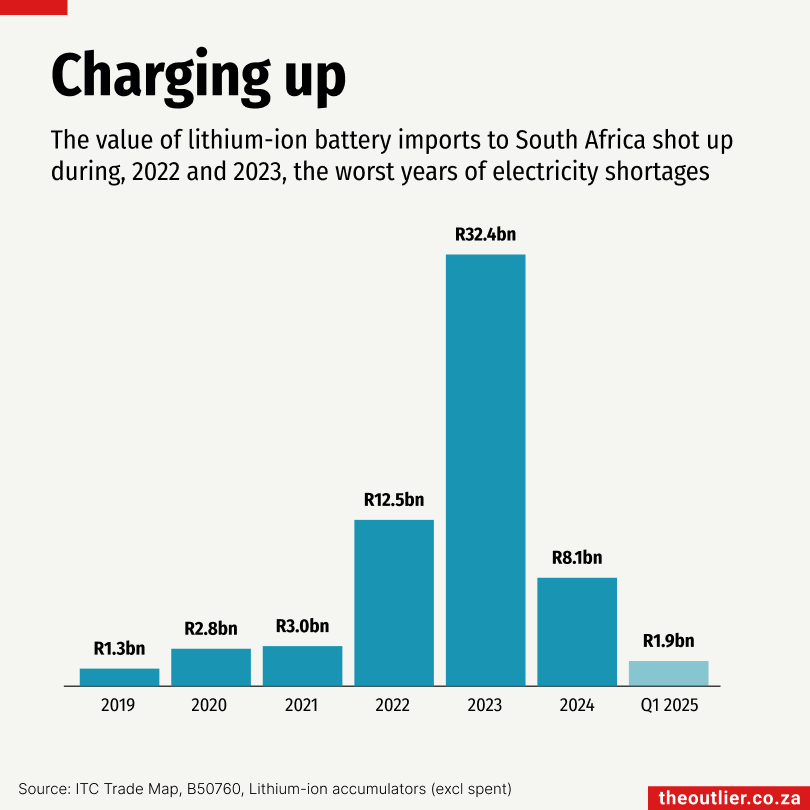
South Africa’s imports of lithium-ion batteries have fallen sharply since the peak of electricity outages in 2022 and 2023.
In 2023, the country imported R32.4-billion worth of lithium-ion batteries. This dropped to R8.1-billion in 2024. In the first quarter of 2025, imports amounted to R1.9-billion, putting the country on track to match last year’s total. Most of these batteries are imported from China.
Despite the decrease in imports, South Africa remains invested in battery energy storage.
Eskom began its battery energy storage project in 2018, planning to install 12 grid-connected storage systems. According to Eskom’s 2024 annual report, three systems have been commissioned so far, one in Worcester, Western Cape, and two in KwaZulu-Natal, with a combined capacity of 68MW/292MWh.
These large-scale storage systems rely on lithium-ion technology, the same type used in the smaller batteries found in the rooftop solar systems installed by households, businesses, farms and factories across the country.
Get the data used in the chart on DataDesk

Monday 21 July 2025
Long seen as a nice-to-have, value-added services (VAS) are now a vital part of South Africa’s payments ecosystem. New research by payments software company Electrum estimates the VAS market to be worth almost R500-billion per year.
In a November 2024 survey of economically active South Africans who manage personal or household payments, the company found that domestic money transfers made up a third of the annual R498-billion spend. This was followed by bill payments, prepaid airtime and data, prepaid electricity and betting vouchers.
The survey was conducted across all nine provinces, with fieldwork in both urban and peri-urban areas. Respondents were selected using quotas based on province, race, age and gender.
Electrum says the findings highlight the growing importance of VAS in everyday financial behaviours.
- Electrum is a next-generation payments software company and trusted partner to leading banks and retailers.
Monday 21 July 2025
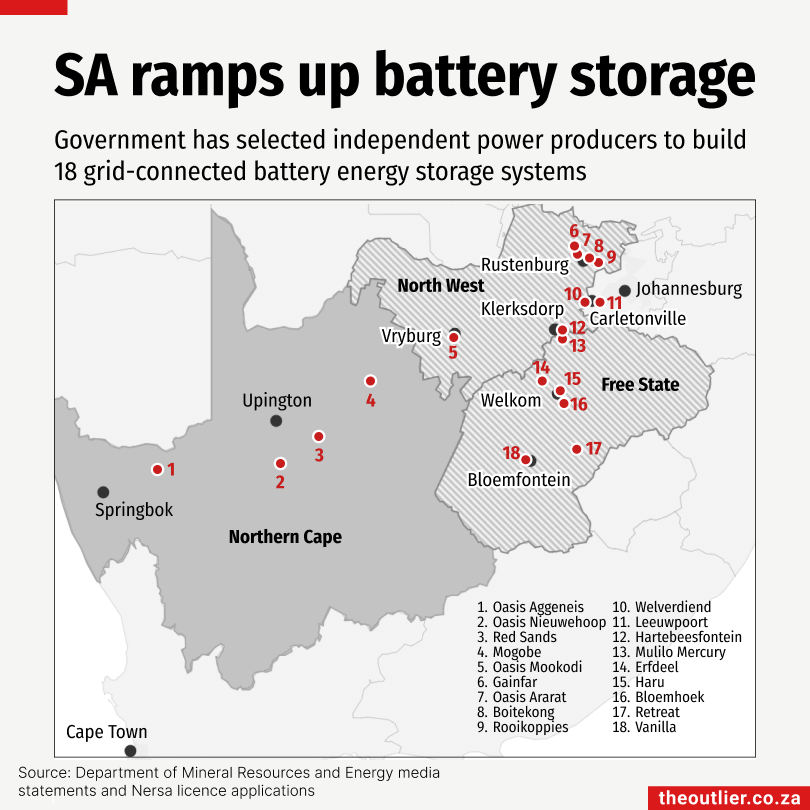
The South African government launched its Battery Energy Storage Independent Power Producer Procurement Programme in March 2023. Since then, it has opened three bid windows and announced 18 preferred bidders. The map above shows the locations of these 18 projects.
Five of the projects have reached ‘financial close’, the stage at which financing is secured and construction can begin. These five are expected to be built and operational by the end of 2026, adding a combined 513MW/2,023MWh of capacity to the national grid.
Why is this kind of grid-connected battery storage important? There are a few reasons, three of which are:
Get the data used in the chart on DataDesk
Five of the projects have reached ‘financial close’, the stage at which financing is secured and construction can begin. These five are expected to be built and operational by the end of 2026, adding a combined 513MW/2,023MWh of capacity to the national grid.
Why is this kind of grid-connected battery storage important? There are a few reasons, three of which are:
- It supports the expansion of renewable energy on the national grid. Battery storage can store the electricity generated by wind and solar when their electricity output is high and release it when it is low.
- Batteries increase the available grid capacity.
- Batteries can be charged from the grid and can store a substantial amount of electricity. This can be used to boost the electricity network during peak hours, reducing the strain on the network.
Get the data used in the chart on DataDesk
Friday 18 July 2025
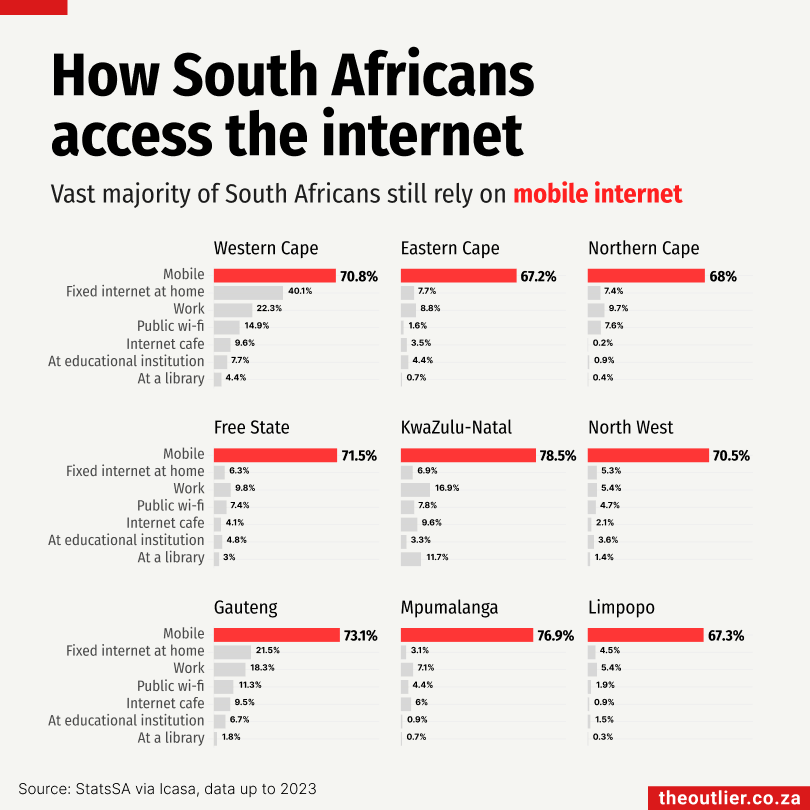
Nearly three-quarters of South Africans go online using a mobile device, with KwaZulu-Natal leading the provinces at 78.5%.
At the other end of the spectrum, just 67.2% of people in the Eastern Cape access the internet via mobile, the lowest rate in the country, reflecting possible challenges in infrastructure or service availability, according to Icasa’s March 2025 State of the ICT Sector in South Africa report.
Access to fixed home internet remains far more limited. Nationally, only 14.5% of South Africans have a home internet connection. The numbers are skewed by relatively high access in the Western Cape (40.1%) and Gauteng (21.5%), while most other provinces are below 10%. In Mpumalanga, just 3.1% of people have fixed home internet.
Beyond the home, South Africans also access the internet through a range of public and workplace options: 14% connect at work, 8% use public Wi-Fi, 6.9% visit internet cafés, 4.6% connect at educational institutions and 3.5% use library networks.

Friday 18 July 2025
Almost all of South Africa’s urban residents are currently covered by 3G and 4G, according to data from Icasa’s March 2025 State of the ICT Sector in South Africa report.
5G coverage is highest in the Western Cape (78%) and Gauteng (76%), and significantly lower in the Northern Cape (38%) and Free State (26%).
3G networks are being phased out in South Africa, and all 2G and 3G networks should be shut down by December 2027. Networks have been prohibited from introducing new 3G devices since December 2024.
4G offer download speeds of around 100Mbps (depending on conditions) while 5G networks are capable of speeds around 10 times that.

Thursday 17 July 2025
The global average cost of battery storage fell by 40% between 2023 and 2024, according to the Volta Foundation Battery Report 2024. Battery energy storage systems are like giant rechargeable batteries that store excess electricity generated by sources, such as solar or wind, so they can be used when needed. In 2024, 69GW of battery storage was deployed around the world, just over half of it in China, followed by the United States.
In 2019, the cost of battery storage was $375 per kilowatt-hour (kWh). By 2024, that price had dropped to $165/kWh. The price decrease has driven a surge in the number of new battery storage projects being built around the world.
South Africa is no exception. In the last year and a half, 18 preferred bidders have been appointed to build grid-linked battery storage capacity under the government’s Battery Energy Storage Independent Power Producer Procurement Programme.

Wednesday 16 July 2025
BRICS countries – Brazil, Russia, India, China and South Africa, and new members Egypt, Ethiopia, Indonesia, Iran and the United Arab Emirates – together accounted for half (51%) of global solar electricity generation in 2024, according to energy think tank Ember’s report “Solar BRICS: Emerging economies now lead the world’s clean energy race.”
China alone generated 39% of the world’s solar power in 2024, up from just 12% a decade earlier. South Africa contributed 0.9%.
Five BRICS countries featured among the world’s top 20 solar power producers. China led globally with 839 terawatt-hours (TWh), followed by the United States (303TWh) and India (137TWh). Brazil ranked sixth with 71TWh, and South Africa placed 16th with 20TWh. The United Arab Emirates, which joined BRICS in 2024, was 20th.

Tuesday 15 July 2025
Five of the world’s top 20 solar power producers in 2024 were BRICS countries, led by China, which generated 839 terawatt-hours (TWh) of solar electricity – more than any other nation. India ranked third globally with 137TWh, after the United States at 303TWh. Brazil followed in sixth place with 71TWh, while South Africa placed 16th with 20TWh. The United Arab Emirates, which joined BRICS in 2024, was 20th.
According to the energy think tank Ember’s report Solar BRICS: Emerging economies now lead the world’s clean energy race, the expanded BRICS group – Brazil, Russia, India, China, South Africa, Egypt, Ethiopia, Indonesia, Iran and the UAE – together produced 51% of global solar electricity in 2024.
China alone accounted for 39% of global solar generation in 2024, up sharply from just 12% a decade earlier. South Africa’s contribution was 0.9%.
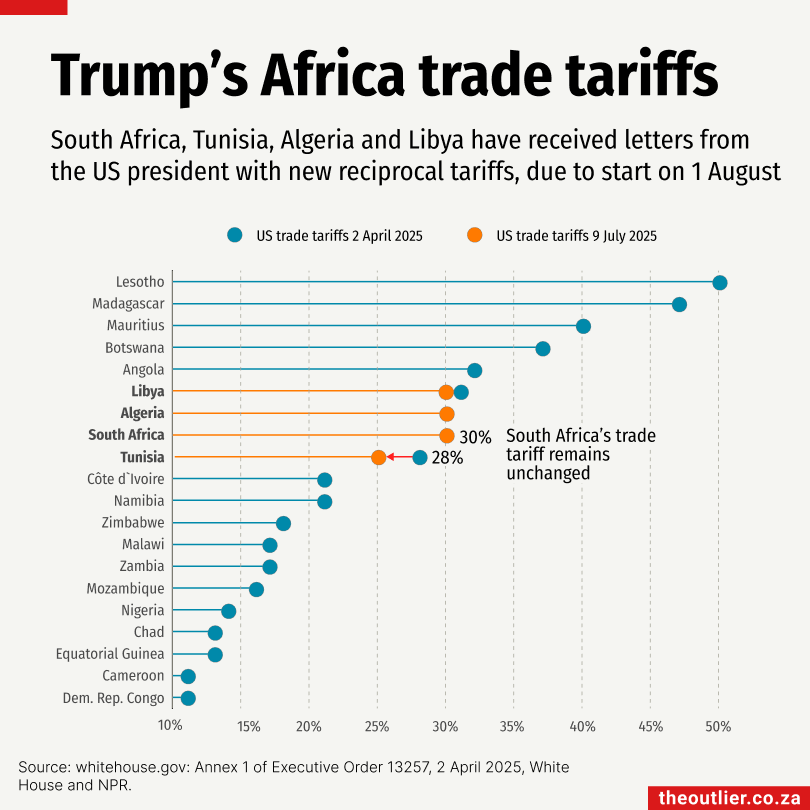
Monday 14 July 2025
United States President Donald Trump’s reciprocal trade tariffs, first announced on 2 April, were set to take effect on 9 July. However, he extended the 90-day moratorium to 1 August and sent letters to more than 20 countries informing them that their tariffs had been revised. South Africa, Tunisia, Algeria and Libya were the only African countries to receive letters so far.
South Africa and Algeria’s tariffs remain unchanged at 30%. Tunisia’s was slightly reduced from 28% to 25%. Libya’s was marginally reduced from 31% to 30%.
A fact sheet on the White House website, which claims President Trump is “the best trade negotiator in history”, hints at a willingness to pursue further trade talks.
President Cyril Ramaphosa said South Africa would continue its “diplomatic efforts towards a more balanced and mutually beneficial trade relationship”.
South Africa’s platinum, gold, coal, manganese and chrome are among the products that have been excluded from the US tariffs.

Friday 11 July 2025
Alcohol use has previously been linked to an increase in femicide, but research on this in lower- and middle-income countries has been relatively scarce. A 2025 study using South African data from the Covid-19 lockdowns offers new insight.
During periods when alcohol sales were completely banned, the number of women killed – by both intimate partners and non-partners – fell by 63% compared to periods without restrictions. Researchers compared national data from 2017 with the first year of the pandemic (2020–21), during which varying lockdown restrictions, including bans on alcohol, were enforced.
The pattern of fewer reported femicide cases was most obvious in the early stages of the Covid restrictions, between April and May 2020.
From the report: “The findings support alcohol use as a significant risk factor for femicide and underline the need for alcohol harm reduction policies as part of gender-based violence prevention strategies.”

Thursday 10 July 2025
Gauteng has the second-highest number of learners enrolled in its public schools. Only KwaZulu-Natal has more. But Gauteng does not have the second-highest number of public schools. It ranks fourth, with 2,068 schools – behind KwaZulu-Natal (5,753), the Eastern Cape (4,990), and Limpopo (3,590).
Those three provinces tend to have many small rural schools.
South Africa’s Schools Act classifies schools by size, ranging from ‘micro primary schools’ with fewer than 135 learners to ‘mega primary schools’ with more than 930 learners. High schools are similarly classified, with ‘micro’ high schools having fewer than 200 learners and ‘mega’ high schools more than 1,000.
When averaging the number of learners per school by province, the contrast becomes clear: Gauteng has the highest average of 1,127 learners per school, followed by the Western Cape at 823 learners. In the rural provinces, the average is much lower. Eastern Cape has 343 learners per school, KwaZulu-Natal has 492, and Limpopo has 482.
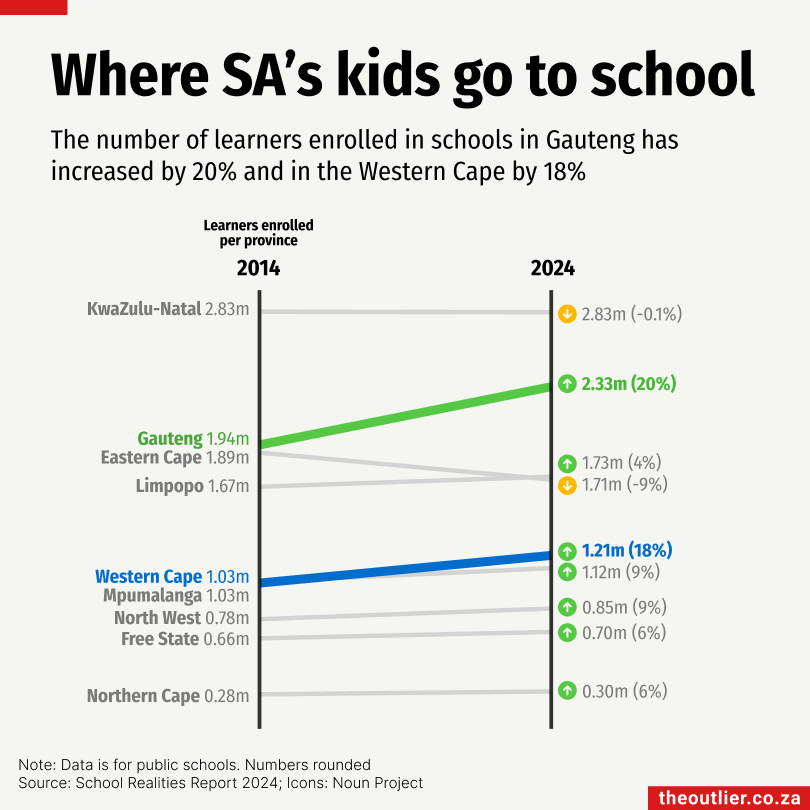
Wednesday 9 July 2025
Gauteng needs around 200 new schools to accommodate the fast-growing number of schoolchildren, according to Matome Chiloane, the province’s education department head. It’s looking to the private sector to help fund this monumental building project.
This year Gauteng reportedly received money from the National Treasury to build 18 schools, but that’s not enough to meet even the immediate need for new schools identified by Gauteng’s education department.
Over the past decade, the number of learners in Gauteng’s public primary and high schools has increased by 20%, from 1.9-million in 2014 to 2.3-million in 2024.
The Western Cape is the only other province that has seen such a rapid rise in learner numbers of 18% from 1-million to 1.2-million. Meanwhile, the Eastern Cape has gone in the opposite direction, with enrolment dropping 9%, from 1.9-million to 1.7-million between 2014 and 2024.
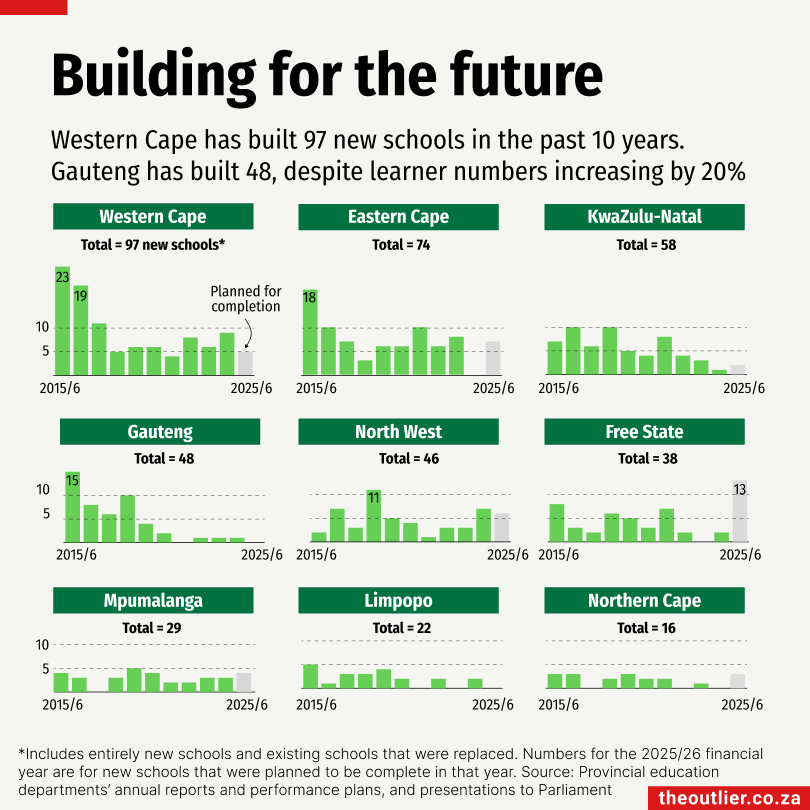
Wednesday 9 July 2025
Learner enrolment in Gauteng’s schools rose by 20% in the past decade from 1.9-million in 2014 to 2.3-million in 2024, but its school-building programme hasn’t kept pace. Only 48 schools were built between 2015 and 2024, according to provincial education reports.
Many of the “new” schools were replacements for old, unsafe structures. Gauteng hasn’t completed a single new school in five years – only replacement schools have been built, a March 2025 presentation to the National Council of Provinces shows.
In contrast, the Western Cape – where learner numbers have also surged – has responded more proactively, completing 97 schools, with five more planned for 2025/26. Three provinces have outpaced Gauteng’s school building.
Even the Eastern Cape has built (or replaced) more schools than Gauteng, completing 74 by 2024. This is despite the number of learners decreasing by 176,000 over 10 years.
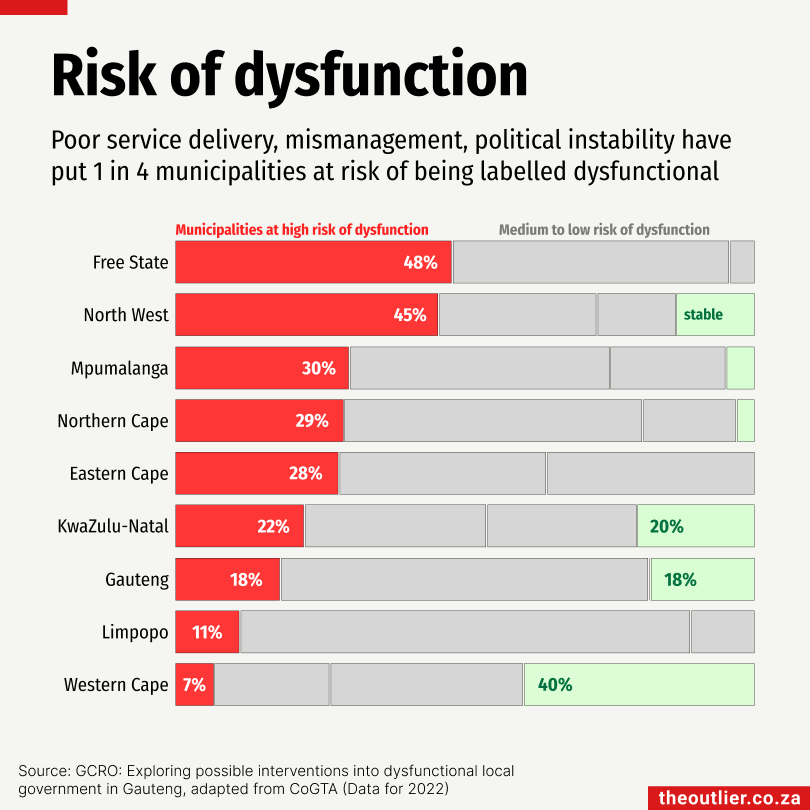
Tuesday 8 July 2025
Out of South Africa’s 257 municipalities, one in four (66) is considered high risk of being dysfunctional. Only 30 – about one in 10 – are classified as stable.
The Department of Cooperative Governance and Traditional Affairs (Cogta)assesses municipal risk by examining political stability, governance, administrative capacity, service delivery, and financial health.
When a municipality experiences ongoing dysfunction, national or provincial governments can, as a measure of ‘last resort’, intervene under Section 139 of the Constitution.
In a report entitled ‘Exploring possible interventions into dysfunctional local government in Gauteng’, Gauteng City-Region Observatory’s Dr Claire Franklyn, draws on Cogta’s data to show just how many municipalities are at risk.
The chart above, based on 2022 data, shows the proportion of local municipalities in each province that are considered at risk of dysfunction – and the small share classified as stable. The Western Cape stands out as the best performer.
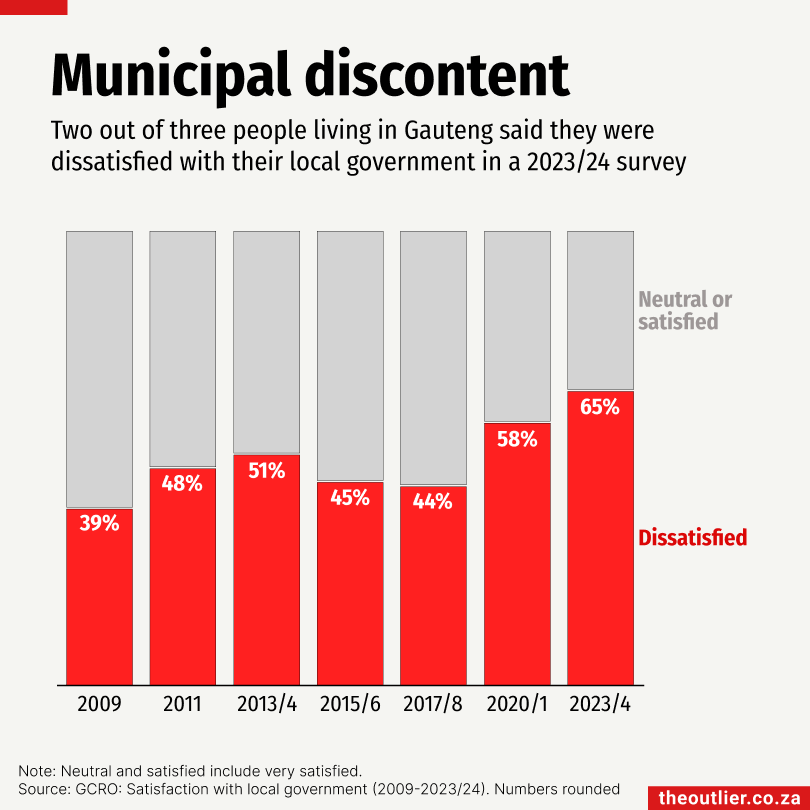
Monday 7 July 2025
Public satisfaction with local government in Gauteng is collapsing.
Nearly two out of three people who were part of the Gauteng City-Region Observatory (GCRO) Quality of Life survey, and 13,795 people were interviewed, said they were either dissatisfied or very dissatisfied with the province’s local governments (aka municipalities).
No surprise there, given the string of service delivery failures. From potholed roads and dry taps to power outages caused by ageing infrastructure, residents have also had to endure a cholera outbreak in Hammanskraal, Tshwane, a deadly fire in the Johannesburg CBD at 80 Albert Street and a gas explosion on Lillian Ngoyi Street, all in 2023.
Frequent mayoral changes since the 2021 local government elections have not helped either.
Public dissatisfaction is unlikely to ease anytime soon. Both Tshwane and Emfuleni have been in concerning financial positions for three and four consecutive years, respectively.

Friday 4 July 2025
Foreign direct investment (FDI) in Africa jumped by a record 75% in 2024, according to UNCTAD’s World Investment Report 2025.
The increase was driven by a $35-billion megaproject backed by the United Arab Emirates, which aims to transform a stretch of the country’s Mediterranean coastline into a major tourism, residential, business and financial hub. The size of the investment made Egypt the top African recipient of foreign direct investment and the ninth-largest globally.
Meanwhile, South Africa, which typically vies with Egypt for the top spot for foreign direct investment, fell to seventh place, behind Ethiopia, Côte d’Ivoire, Mozambique, Uganda and the Democratic Republic of Congo.
South Africa’s strong showing in 2021 was largely due to a one-off share exchange between Prosus NV and Naspers, which inflated its foreign investment figures.
Angola’s FDI has been in negative territory for the past few years due to the repatriation of investments by foreign companies, especially in the oil sector.

Friday 4 July 2025
Only 32 countries in the world host AI-focused data centres and fewer than 20% of those are in the Southern Hemisphere. The vast majority of data centres are clustered around Europe and the UK, in the United States and China. 90% of the world’s AI data centres are controlled by either the US or China.
A new study from Oxford University has sparked much-needed debates about the future of AI, and who ultimately controls it and who has access to it. The entire continent of Africa, apart from South Africa, and most of South America has none of the infrastructure required to build, train and run AI models.
As University of Pretoria’s ABSA Chair of Data Science Vukosi Marivate says: “This divide isn’t just about technology. It means limited innovation, lost competitiveness, brain drain, lack of data sovereignty, and the economic benefits of AI flowing elsewhere. Access to compute is no longer optional – it’s essential for digital sovereignty and for shaping our own AI future.”

Wednesday 2 July 2025
South Africa imports most of its petroleum and crude oil from Nigeria and Saudi Arabia. In 2023, it imported $2.28-billion (46.1%) from Nigeria and $1.62-billion (32.7%) from Saudi Arabia, according to Harvard’s Atlas of Economic Complexity.
In June 2025, Saudi Arabia was exporting 7.2-million barrels of oil per day through the Strait of Hormuz. It is one of six major oil producers – alongside Iran, Iraq, Kuwait, Qatar and Oman – that rely on Hormuz to ship oil, much of it destined for Asian markets.
The Strait of Hormuz is the world’s second-busiest oil transit chokepoint after the Strait of Malacca. In 2023, 20.9-million barrels of crude oil and petroleum products passed through Hormuz each day, compared to 23.7-million through Malacca.
Any blockade or disruption in the strait would likely push up global oil prices – and South Africans would feel it at the pump. Higher fuel costs would ripple through the economy, raising the transport prices, food, and other essentials.

Wednesday 2 July 2025
Iran is one of the world’s top crude oil producers, averaging 5.1-million barrels per day in 2024. When Israel launched its war with Iran, oil prices spiked amid fears of supply disruptions.
Part of that anxiety stems from geography: Iran borders the Strait of Hormuz, a critical maritime chokepoint through which a fifth of the world’s oil supply passes en route from the Persian Gulf to the Gulf of Oman.
Six of the world’s biggest oil producers – Saudi Arabia, Iran, Iraq, Kuwait, Qatar and Oman – rely on Hormuz to export their oil, most of it bound for Asian markets.
Tensions escalated further when the United States bombed Iran’s nuclear facilities on 22 June 2025. Fears mounted that Iran would retaliate by blocking the strait.
The Strait of Hormuz is the second-busiest oil transit route in the world, after the Strait of Malacca. In 2023, 20.9-million barrels of crude oil and petroleum products moved through Hormuz daily, compared to 23.7-million through Malacca.

Friday 27 June 2025
The severe weather that hit the Eastern Cape in early June has been classified a national disaster.
Devastating floods killed more than 90 people, with Mthatha the hardest hit. On 9 June 2025 alone, the town recorded 129mm of rain – breaking a 28-year record set in 1997, when 76.6mm fell on the same date.
The head of the Disaster Management Centre classified the event as a national disaster, which allows different levels of government to step in and coordinate response and recovery efforts.
Since 2015, 76 events have been classified as disasters at various levels of government – more than a third of them due to severe weather, including floods, hailstorms and strong winds. The Eastern Cape has been affected by 11 of these weather-related disasters.
This is the second disaster to hit the province in 2025. In January, heavy rains also triggered a disaster classification.

Friday 27 June 2025
When disasters strike, the National Disaster Management Centre, under the Department of Cooperative Governance and Traditional Affairs, can disburse two types of grants: response grants for emergency relief – such as urgent repairs to infrastructure and emergency provision of goods and services – and recovery grants to support the longer-term rehabilitation and reconstruction.
In the 2023/24 financial year, R873-million rand in disaster response grants was allocated to 75 municipalities. Yet only 25 municipalities spent 80% or more of their funding. Thirty municipalities didn’t spend a cent. By year-end, just R220.5-million – 25% of the total available – had been used.
King Sabata Dalindyebo local municipality was one of 22 municipalities in the Eastern Cape that received disaster relief funding in the 2023/24 financial year. It was granted R5.4-million and spent 94% of it, which is encouraging.
Unspent funds may be reallocated by the National Treasury unless already committed to projects.

Friday 27 June 2025
President Donald Trump banned travel to the United States for citizens of seven African countries and restricted access for another three countries from 9 June.
In a separate list, he included an additional 24 African countries that may be subject to travel restrictions if they didn’t provide ‘remediation plans’ for concerns identified by the US government that include security vetting and people overstaying their US visas, according to the New York Times.
The 34 countries are:
Banned: Chad, Republic of Congo, Equatorial Guinea, Eritrea, Libya, Somalia and Sudan.
Restricted travel: Burundi, Sierra Leone and Togo. People from these countries cannot go to the US permanently or get tourist or student visas.
May be restricted: Angola, Benin, Burkina Faso, Cameroon, Cape Verde, the Democratic Republic of Congo, Djibouti, Ethiopia, Egypt, Gabon, Gambia, Ghana, Côte d’Ivoire, Liberia, Malawi, Mauritania, Niger, Nigeria, São Tomé and Príncipe, Senegal, South Sudan, Tanzania, Uganda, Zambia and Zimbabwe.

Friday 27 June 2025
An increasing proportion of people say they avoid reading, watching or listening to the news. According to this year’s edition of the Reuters Institute’s Digital News Report, 40% of people say they sometimes or often avoid the news, up from 29% in 2017. At 41%, the South Africans who took part in the survey were in line with the global average.
The top eight reasons people avoid the news are:
– It has a negative effect on their mood
– They are worn out by the amount of news
– There is too much coverage of conflict/war
– There is too much coverage of politics
– There is nothing they can do with the information
– It leads to arguments they’d rather avoid
– It doesn’t feel relevant to their lives
– It’s too hard to understand

Monday 23 June 2025
South Africans wagered more than R1-trillion in 2024.
Betting on sports and other contingencies is driving this surge. Half the gross revenue from gambling is from online betting, according to National Gambling Board statistics.
In the 2023/24 financial year alone, the gambling industry generated R59.3-billion in gross revenue. The Western Cape overtook Gauteng as the top-earning province, pulling in R18.78-billion, compared to Gauteng’s R13.01-billion. Mpumalanga followed closely with R12.98-billion.
A survey conducted by ,a href=”https://themediaonline.co.za/2025/05/upping-the-ante-tracking-the-year-on-year-growth-of-gambling-in-sa/”>InfoQuest in April 2025 – a follow-up to its March 2024 study of roughly 300 South African gamblers – found that nearly half (48%) reported gambling more frequently than they had a year ago.
“This surge in frequency points to growing engagement, possibly fuelled by the rise of easily accessible online platforms, aggressive marketing, and shifting social norms,” said Claire Heckrath, managing director of InfoQuest. But how are people funding their gambling? According to Heckrath, a third of gamblers claim to use surplus funds. “This means that a concerning 63% are likely using money meant for essentials, savings, or other financial commitments,” she said.

Monday 23 June 2025
People in South Africa wagered more than R1-trillion in the 2023/24 financial year.
Two-thirds of that total was spent on betting, mainly on sports and horse racing, according to the National Gambling Board.
Of the nine provinces, Mpumalanga recorded the highest gambling spend at R359.3-billion, followed closely by the Western Cape at R353.2-billion. Gauteng trailed at R173.7-billion.
In Mpumalanga and the Western Cape, betting is the clear favourite, accounting for 96% and 84% of gambling spend respectively. In contrast, Gauteng remains a stronghold for casinos, where 77% of its gambling turnover was recorded. Casinos also led in KwaZulu-Natal, the Free State and the Eastern Cape.
Nationally, betting now far outpaces other forms of gambling, generating a turnover of R761-billion – more than double that of casinos, which brought in R297-billion.
All this activity contributed R4.8-billion to government revenue through taxes and levies in the 2023/24 financial year.

Monday 23 June 2025
People in South Africa wagered more than R1-trillion in the 2023/24 financial year.
Of the nine provinces, Mpumalanga recorded the highest gambling spend at R359.3-billion, followed closely by the Western Cape at R353.2-billion. Gauteng trailed at R173.7-billion.
In Mpumalanga and the Western Cape, betting is the clear favourite, accounting for 96% and 84% of gambling spend respectively. In contrast, Gauteng remains a stronghold for casinos, where 77% of its gambling turnover was recorded. Casinos also led in KwaZulu-Natal, the Free State and the Eastern Cape.
Bingo, while a smaller slice of the pie nationally, is relatively popular in the North West and Eastern Cape, where it contributes around a quarter of gambling turnover.
Nationally, betting now far outpaces other forms of gambling, generating a turnover of R761-billion – more than double that of casinos, which brought in R297-billion.
All this activity contributed R4.8-billion to government revenue through taxes and levies in the 2023/24 financial year.

Friday 20 June 2025
The highest-paid city manager in 2023/24 was in Ekurhuleni, with a remuneration package of R4.57-million. Cape Town’s city manager followed closely at R4.49-million, while eThekwini and Johannesburg paid R3.84-million and R3.36-million respectively.
City managers typically out-earn mayors. In Johannesburg, for example, the mayor earned R1.58-million – nearly half of what the city manager received.
Mangaung’s city manager earned significantly less, but only because he took office on 1 November 2023 and did not serve the full financial year.
Why the high salaries? City managers are effectively the chief executives of municipalities. They are responsible for implementing policies, managing service delivery, and ensuring that local governments comply with legislation – making them key to a city’s performance.

Friday 20 June 2025
Even though it’s been more than five years since the first major Covid lockdown, the effect of the pandemic remains. One of the sectors most affected by the global lockdown was tourism and travel.
Five years after Covid, international arrivals in South Africa are much improved but not yet back to pre-Covid highs.
Arrivals in 2024 were almost 9-million, still 13% down on the highs of 2017 and 2018. Kenya, in comparison, has recovered and even exceeded pre-Covid arrivals in the time since the lockdowns, albeit off a smaller base.
The vast majority of arrivals in South Africa are from within Africa, especially SADC (Southern African Development Community) countries. In 2024, 6.6-million arrivals in SA were from SADC countries, or 74% of the total.
The majority of SADC visitors to South Africa stayed in the country for 2 to 4 days. Visitors from overseas spent an average of 8 to 14 days in the country.

Friday 20 June 2025
People in South Africa wagered more than R1-trillion last year. Two-thirds of it was spent on betting, mostly online, on things like sports and horse racing. The money spent on betting has been going up since around 2021. The turnover from betting now far surpasses casinos, which used to be the most popular way to gamble.
Betting on sports and other contingencies is driving this surge.
“Gambling has transitioned from a pastime enjoyed by small pockets of society to being a commonplace activity,” notes the National Gambling Authority.
In an April 2025 survey conducted by InfoQuest – a follow-up to its March 2024 study on approximately 300 gamblers in South Africa – nearly half (48%) said they are gambling more often than a year ago.
According to Claire Heckrath, managing director of InfoQuest, “This surge in frequency points to growing engagement, possibly fuelled by the rise of easily accessible online platforms, aggressive marketing, and shifting social norms.”
Get the data used in the chart on DataDesk

Friday 13 June 2025
South Africa has long been Africa’s leader in motor vehicle production, but that dominance is now being challenged by Morocco, while Algeria is starting to ramp up production from a smaller base.
In 2024, South Africa produced 599,755 vehicles, only slightly ahead of Morocco’s 559,645. Morocco has already overtaken South Africa in passenger vehicle production, manufacturing 524,467 units – about 174,000 more than South Africa.
Morocco is increasingly focusing on the electric vehicle (EV) sector. In early June, officials in Morocco announced plans to boost EV production by more than 50% this year, targeting 107,000 EV units by the end of 2025.
Morocco’s proximity to the EU market is a clear advantage, while South Africa faces a number of challenges including stricter EU emissions targets on traditional combustion vehicles, transport costs and often unstable infrastructure.

Thursday 12 June 2025
State salaries are under fresh scrutiny as budget pressures mount and government debt soars – but the pay at state-owned enterprises is particularly staggering. The Development Bank of South Africa CEO tops the list, earning R15.5-million a year, nearly R1.3-million a month. The next highest earners are Transnet’s CEO at R8.5-million a year, closely followed by South African Revenue Services’ CEO at R8.2-million.
We’ve compiled the remuneration packages of the 122 state-owned enterprises CEOs using responses from 18 government ministers to parliamentary questions. The electricity and energy minister’s response was incomplete due to a broken link, so Eskom’s financials were used to estimate its CEO’s pay.
The top 15 earners all take home R6-million a year or more – not including performance bonuses. None of the 122 CEOs earns less than R1-million a year.

Wednesday 11 June 2025
It won’t come as a surprise that the five richest people in the world are tech billionaires based in the United States, according to Bloomberg’s Billionaires Index.
At number one – as of the close of business on 5 June 2025 – is Elon Musk (yes, born in South Africa, but now an American citizen), with a net worth of $368-billion. To put that in perspective, only two African countries have economies larger than Musk’s fortune – South Africa, with a GDP of $400-billion, and Egypt, at $383-billion.
The graphic above compares the net worth of the world’s top five richest men to the GDPs of Africa’s five largest economies, based on the IMF’s World Economic Outlook (April 2025).
Altogether, the combined net worth of the top 10 on Bloomberg’s latest billionaires index stands at $1.97-trillion – exceeding the entire GDP of Sub-Saharan Africa, which the IMF estimates at $1.88-trillion for 2024.

Tuesday 10 June 2025
The number of people using South Africa’s trains is slowly recovering, driven by improvements in the commuter rail service network.
In March 2024, Statistics South Africa recorded 4.7-million train journeys. A year later, that figure had risen to 7.4-million. But this is still nowhere near the highs of 2009, when there was an average of 52-million journeys per month.
Over the past year, the Passenger Rail Agency of South Africa (PRASA) has significantly expanded the number of operational lines. By March 2025, 34 of PRASA’s 40 commuter service lines were running – up dramatically from just four in the aftermath of the Covid-19 pandemic.
Train services ground to a halt in late March 2020 during the country’s initial hard lockdown. Although operations resumed as restrictions eased, the recovery was hampered by widespread vandalism and theft at rail stations and along the tracks. The revival of the rail network is a critical step in restoring affordable public transport.

Monday 9 June 2025
Around 24,000 runners entered the 98th Comrades Marathon in 2025, with the largest group made up of men aged 40 to 49 (8,171 entries), followed by senior men aged 20 to 39 (5,329), and men aged 50 to 59 (4,395).
On Sunday, 8 June, roughly 22,000 runners completed the approximately 89km Down Run from Pietermaritzburg to Durban. The gap between entries and actual participants is typically due to injuries, personal circumstances, or failure to meet qualifying standards.
Entry fees were set at R1,200 for South African citizens, R2,000 for entrants from the rest of Africa, and R4,500 for international runners.
Tete Dijana claimed victory with a time of 5:25:28, while Gerda Steyn was the first woman over the finish line with a time of 5:51:19.
First held in 1921, the Comrades is the world’s oldest and largest ultramarathon. The race alternates annually between the up run (Durban to Pietermaritzburg) and the down run (Pietermaritzburg to Durban).

Friday 6 June 2025
Since the 2021 local elections, metro leadership across South Africa has been volatile.
Johannesburg has had six mayors, driven by resignations, court rulings, and no-confidence motions. Dada Morero currently holds the position. Ekurhuleni and Tshwane have each seen four mayoral changes, the latter due to scandals, poor audits and no-confidence motions. ActionSA’s Nasiphi Moya now leads Tshwane.
In the Eastern Cape, Nelson Mandela Bay also had multiple shifts. The current mayor is ANC’s Babalwa Lobishe. Buffalo City saw one change, with Princess Faku replacing Xola Pakati.
Cape Town remains the most stable, with Geordin Hill-Lewis continuing since 2021. Ethekwini had one change in 2024, and Mangaung had two mayoral changes.
Things were not much more stable after the 2016 elections. Johannesburg, Tshwane, and Nelson Mandela Bay each cycled through four mayors during that term, often due to motions of no confidence, resignations, or death in office.

Friday 6 June 2025
In 2024, over 695,000 Schengen visa applications from across Africa were denied, resulting in more than $70-million lost in non-refundable fees. West Africans bore the brunt of these visa rejections.
A Schengen visa, which allows short stays in 29 European countries, costs €90 (about R1,800) per application and is non-refundable, even if the visa is denied.
Nigeria was hit the hardest, with 45.3% of its 111,201 applications rejected. Only 58,808 were approved – meaning Nigerians lost over $5-million in fees for unsuccessful applications.
Other West African countries followed closely:
– Senegal: $3.3-million lost
– Côte d’Ivoire: $2.6-million
– Ghana: $2.5-million
In East Africa, 28.5% of Kenyan applications were rejected, resulting in $1.9-million in lost fees.
South Africans fared far better, with just 5.6% of 193,768 applications rejected. Still, that relatively low rate translated into more than $1-million in lost fees.

Friday 6 June 2025
Africans lost over $70-million in rejected Schengen visa fees in 2024. Nigerians were hit hardest, with 45.3% of applications denied, followed closely by Ghanaian applicants at 44.5%.
A Schengen visa, which allows short stays in 29 European countries, costs €90 (around R1,800) and is non-refundable.
Data from the European Commission shows that there were 111,201 applications by Nigerians for Schengen visas in 2024, and only 58,808 of those were granted. That means that over $5-million was spent (and lost) by Nigerians whose visa applications were turned down.
South Africans fared much better, only 5.6% of the 193,768 applications were rejected. Still, that translates to over $1-million (or R19.7-million) in lost fees. People travelling from the United States and China had 4% and 4.5% of their Schengen visas rejected.
The average rejection rate for Schengen visas for all countries is 16.9% while the rejection rate for African applications is 27%.

Friday 6 June 2025
In the world of computer programming, Stack Overflow was a giant.
For more than a decade, it was the go-to site for asking tech-related questions.
At its peak, more than 300,000 questions* were posted on Stack Overflow every month, and many of them had dozens, if not hundreds, of responses. Stack Overflow was massive.
That’s why Naspers-owned Prosus paid $1.7-billion to acquire it in August 2021. Many argued it was an overpriced deal, but given Stack Overflow’s influence and reach, it could have made sense.
But it didn’t.
In November 2022, ChatGPT was launched – and new data shows Stack Overflow activity plummeted over the next two years, dropping from over 200,000 questions a month to just a few thousand, as developers increasingly turned to AI for answers.
Today, most of Prosus’s investment in Stack Overflow has been written off. The once-dominant platform is now all but dead.
*Note: The question data includes all posts, including deleted posts, as an indicator of activity.* The data is from here.

Friday 6 June 2025
Mozambique is South Africa’s largest African trade partner, with exports reaching nearly R120-billion in 2024. According to the South African Revenue Service, it ranks among the top five destinations for South African exports. Key goods include chromium ore (26%), ferroalloys (17%), iron ore (8.5%), coal (7%), electrical energy (5%), and cleaning products (2%), along with motor vehicles, corn, cereals, and soya beans.
Trade with Mozambique has grown significantly over the past 14 years, rising from just R13.8-billion in 2010 to nearly R120-billion in 2024. While Mozambique leads among African trade partners, it still lags behind global export destinations such as China (R220-billion), the United States (R157-billion) and Germany (R154-billion).
South Africa’s other major African trade partners are, unsurprisingly, its immediate neighbours: Botswana (R78.9-billion), Namibia (R70.4-billion), Zimbabwe (R69.2-billion), and Zambia (R55.6-billion).
On the import side, Nigeria is South Africa’s largest African source, with imports totalling R46.7-billion in 2024 – comprising almost exclusively crude petroleum, according to the Observatory of Economic Complexity.
Get the data used in the chart on DataDesk.

Thursday 5 June 2025
Most murders do not happen on South African farms – despite claims by US President Donald Trump that white farmers are under attack – a narrative not supported by the country’s crime data.
In the last quarter of 2024, more than 6,000 murders were recorded nationwide, according to official police statistics. Just 96 took place on farms, plots, and small holdings – a broad category that likely includes farm workers and nearby residents, not just landowners or “white farmers.” In contrast, 244 murders took place in pubs, taverns, and bottle stores. Public places saw the highest number of murders (3,821), followed by private homes (1,966).
The majority of South Africa’s murder victims are young Black men. As Gareth Newham of the Institute for Security Studies explains,“Murder victimisation is far more correlated to class, gender and location than race.”

Thursday 5 June 2025
In the 2023/24 financial year, only 41 of South Africa’s 257 municipalities (16%) received a clean audit, meaning their financial and performance reports were credible and reliable. Cape Town was the only metro to achieve this.The rest had concerning audit outcomes:– 99 unqualified with findings: Material misstatements were corrected, but issues like weak capacity and poor internal controls remained.
– 90 qualified opinions: Financial statements had material errors and couldn’t be fully trusted.
– 6 adverse opinions: Statements were deemed “not useful” for decision-making.
– 11 disclaimed opinions: The Auditor-General couldn’t assess the finances due to a lack of evidence.
– 10 audits outstanding: Yet to be finalised.
Audit opinions are a critical measure of whether councillors, residents, and higher levels of government can rely on a municipality’s reporting to make decisions and ensure accountability.

Thursday 5 June 2025
South Africa’s metros are expected to set the standard for good governance – but most are falling short. Despite serving nearly half the country’s households and having larger budgets and capacity, Cape Town was the only metro to receive a clean audit in 2023/24, according to Auditor-General Tsakani Maluleke.
Audit opinions are a key test of whether councillors, residents, and higher levels of government can trust a municipality’s financial and performance reporting. But metro audit outcomes are deteriorating.
Buffalo City, Mangaung, Nelson Mandela Bay, and Tshwane all received qualified audits, meaning their financial statements contained material errors and could not be fully trusted. Even more concerning, Tshwane and Mangaung disclosed “significant doubt” about their ability to continue operating.
In her report, the Auditor-General was blunt: metros are “plagued by poor revenue management, debt collection and budgeting practices, coupled with financial losses due to poor-quality spending.”

Wednesday 4 June 2025
The petrol levy is now R4.01 per litre, its first increase since 2021/22, when it rose from R3.70 to R3.85. The fuel levy had remained unchanged for three years after it was last raised from R3.70 to R3.85 in the 2021/22 financial year. According to the May 2025 Treasury Budget Overview, the freeze was intended “to provide consumers with relief from high fuel price inflation.”
The latest hike – 16c for petrol and 15c for diesel – may seem minor to some, but it hits poorer communities hardest.
When fuel prices rise, so do transport costs. According to the Pietermaritzburg Economic Justice & Dignity Group, a person earning minimum wage and taking two taxis to and from work can spend more than a third of their monthly income on transport.
Higher fuel costs also push up the price of goods and services across the economy, meaning the impact goes far beyond the pump.
The only silver lining? Despite the levy and carbon tax increases, June’s petrol price decreased – thanks to a lower basic fuel price.

Wednesday 4 June 2025
The fuel levy hike is expected to bring in R23-billion by 2028, following increases of 16c for petrol and 15c for diesel. This comes after Treasury opted not to raise value-added tax to 15.5%. In his May 2025 budget speech, Finance Minister Enoch Godongwana said the levy hike was the only new tax proposal being introduced.
The fuel levy had remained unchanged since the 2021/22 financial year when it rose from R3.70 to R3.85. Treasury said the pause was intended to ease pressure from high fuel price inflation.
But the latest increase hits low-income South Africans hardest. Rising fuel prices drive up transport costs – a major expense for the working class. According to the Pietermaritzburg Economic Justice & Dignity Group, someone earning minimum wage and taking two taxis to and from work can spend more than a third of their income on transport alone.

Wednesday 4 June 2025
South Africa’s consumer price index (CPI) rose slightly from 2.7% in March to 2.8% in April 2025. The main contributors to the uptick were housing and utilities, food, beverages, tobacco, and restaurant and accommodation services.
The rise in food prices was “mainly due to higher meat prices, particularly for beef products such as stewing beef, mince, and steak,” according to Statistics South Africa.
Over the past year, the prices of several everyday items have increased significantly. A kilogram of apples is up 22.4%, rising from R22.46 in April 2024 to R27.48 in April 2025. Instant coffee increased by almost 18%, from R61.99 for 250g to R73.09. Other hot beverages also saw price hikes: Ceylon tea rose by 13.6%, while rooibos tea was up 6.9%.
Not all prices rose, however. A six-pack of eggs, for example, is now 5.3% cheaper than a year ago, down from R25.25 to R23.92.
Tuesday 3 June 2025
The United States is South Africa’s second-largest export market, after China. In 2024, South Africa exported goods worth R157-billion to the US, compared to R220-billion to China. Germany, the third-largest export destination (R154-billion), is steadily closing the gap with the US.
In 2021, South Africa exported a record R193-billion in goods to the US, driven by a surge in platinum group metal prices. Nearly half of South Africa’s exports to the US are precious metals and stones. South Africa’s trade delegation is lobbying the US for more favourable terms ahead of a July deadline when a 90-day freeze on the proposed 31% tariff is set to expire. However, according to Minister of Trade, Industry and Competition Parks Tau, some critical minerals have been exempted from tariffs. The existing 10% tariff applies to vehicles, machinery, and agricultural products.
Get the data used in the chart on DataDesk

Tuesday 3 June 2025
Precious metals and stones are South Africa’s largest exports to the US, making up nearly half of total exports. Notably, platinum group metals – platinum, palladium, rhodium, ruthenium, iridium, and osmium – account for 25% of exports. In the chart above, these are broken down into smaller subcategories. Vehicles make up 13% of exports, with petrol and diesel cars contributing 10%. Base metals follow at 12%, then chemicals (7%), agriculture (6%), and machinery (3%). Among agricultural exports, citrus fruits are the biggest agricultural exports to the US.
South Africa’s trade delegation is lobbying the US for more favourable terms ahead of a July deadline when a 90-day freeze on the proposed 31% tariff is set to expire. However, according to Minister of Trade, Industry and Competition Parks Tau, some critical minerals have been exempted from these tariffs. The existing 10% tariff applies to vehicles, machinery, and agricultural products.
The data used in this chart can be downloaded from Atlas of Economic Complexity, Harvard Growth Lab.

Monday 2 June 2025
Fewer people in South Africa are saying “I do.”
In the past 20 years, the number of registered civil marriages dropped by more than 40% – from 178,689 in 2003 to 99,289 in 2023, according to Statistics South Africa.
The reasons are complex, but one clear trend is a growing preference for long-term partnerships outside traditional marriage structures.
And when people do get married, they’re doing it later in life. The median age for first-time brides rose from 28 in 2002 to 33 in 2023. For grooms, it increased from 32 to 36.
The groom tends to be older than the bride in first-time marriages. Only 10% of first-time civil marriages in 2023 were between couples of the same age.
Civil marriage is the most common of South Africa’s three legally recognised forms of marriage, making up 95% of all registrations.

Monday 2 June 2025
Customary marriages in South Africa have decreased by a staggering 80% over the past two decades, according to Statistics South Africa.
Many of these unions aren’t registered right away. In 2023, 9 in 10 were recorded a year after the actual wedding date, but this doesn’t fully explain the steep drop.
Most of the customary marriages that are registered are in just three provinces: Limpopo (27%), KwaZulu-Natal (22%), and the Eastern Cape (18%).
And who’s getting married? The median age of the bridegroom was 35, while the bride was 29, a six-year age gap in customary marriages registered between 2019 and 2023.
Customary marriage is one of the three legally recognised forms of marriage in South Africa. It falls under the Recognition of Customary Marriages Act, which came into effect in 2000.

Monday 2 June 2025
Women in South Africa are less likely to be married than any other country in Africa. Only a third of women aged 15 to 49 were married or in a union, according to United Nations estimates.
Globally, nearly two out of three (64%) of women in this age group are married.
In the higher-income countries the proportion tends to be lower. For example, in the United States, Germany, France, and Australia, about half of women are married or in unions, the UN estimates.
South Africa at 33% is notably lower, as are our neighbours, Namibia and Eswatini, where the marriage rate for women is 35%.
In all three countries the marriage rate started to decrease in the 1990s, but the UN projects that this will increase to above 40% by 2050.
Niger, on the other hand, has the highest proportion in Africa of women in this age group married or in a union – over 80% – but that is already on a downward trend and is projected to decrease to around 60% by 2050.

Monday 2 June 2025
In Jane Austen’s time, a 27-year-old woman might have been considered an “old maid” – too old to marry – and a burden to her family. These days a women who gets married at the age of 27 would be younger than average in many countries, according to World Bank data.
Of course, much has changed since the early 1800s: life expectancy was around 40 years in the United Kingdom, now it’s over 81 years.
South Africa doesn’t have the oldest brides in Africa, according to the World Bank’s data. In Namibia, the average age of marriage for women is 30, the oldest on the continent.
We used the World Bank data so we could compare countries, but it is a little out of data. The latest data (2023) from Statistics South Africa puts the median age of first-time brides in South Africa at 33.
In high-income countries, like the Netherlands, Italy, and Germany, women marry in their 30s.
In China and India women marry in their early 20s and in parts of Africa, brides are even younger, for example, women in Mali and Mozambique marry at an average age of 19.

Tuesday 20 May 2025
People in South Africa are not in a hurry to get married. The latest national census found that only 24% were legally married, another 8% were living together as husband and wife or partners. But nearly two-thirds said they had never been married.
The number of marriages registered in the country has plunged over the past 20 years, according to Statistics South Africa’s latest marriages and divorces report.
This is not unique to South Africa. The proportion of people getting married is decreasing in many countries. But South Africa stands out for the extremely low proportion of its population that is married or in a union.
For example, only a third (33.3%) of South African women between the ages of 15 and 49 were married or in a union in 2024, according to United Nations estimates. That’s the lowest percentage of all African countries and the third lowest in the world.

Tuesday 20 May 2025
Civil unions or partnerships were introduced in South Africa in November 2006 as an option for same-sex couples, although opposite-sex couples also choose to marry this way.
An increasing number of couples have been choosing this option – the number of unions has increased from just 80 in 2007 to 2,297 in 2023, although there was a bit of a dip in 2023.
The number of civil marriages, on the other hand, have plunged by more than 40% in the past 20 years. There is a growing preference for life partnerships over traditional marriage structures.
Customary marriages have seen an even sharper drop, of 80%.

Tuesday 20 May 2025
People in South Africa are getting married older. The median age of first-time brides was 33 years in 2023, five years older than in 2002 when new brides were 28 years old.
Men are four years older, 36 years old compared with 32.
In 2023, only 10% of first-time civil marriages were between individuals of the same age. In the majority of cases (75%), the groom was older than the bride.
Many people are choosing to further their education or build a career before they get married. Financial stability is also a factor, and the cost of a wedding can be terrifying.

Thursday 24 April 2025
More than 40% of the world’s electricity was generated using low-carbon energy sources – renewables plus nuclear – in 2024, according to Ember, an independent energy think tank.
Solar has been driving the rise in renewables and contributed 6.9% of the electricity mix in 2024.
Fossil fuels are still the source of almost 60% of the world’s electricity, although down a bit from 60.6% in 2023. Coal is the biggest source at 34.4%, followed by gas at 22%.
The chart on the left shows the amount of electricity generated in terraWatt hours from each of the clean energy sources between 2000 and 2024.
Nuclear has remained relatively static, while hydro, wind, solar and other renewables, such as bioenergy, geothermal, tide and wave energy have increased.

Thursday 24 April 2025
Ten years ago, in 2014, 90% of South Africa’s electricity was generated from coal, in 2024 it was 82%, according to global energy think tank Ember’s data. In January 2025, coal reached a new monthly low of 74.3% of the electricity mix.
The rise of low-carbon energy in the past decade has been remarkable. More than 40% of the world’s electricity was generated using low-carbon energy sources – renewables plus nuclear – in 2024, according to Ember.
Solar has been driving the rise in renewables and contributed 7% of the electricity mix in 2024. South Africa generated 8% of its electricity from solar sources in 2024.
Thanks to the rapid increase in renewables, South Africa generated 16.7% of its electricity from low-carbon sources in 2024. Only 3.5% of that was nuclear, five years ago nuclear contributed 5%.
Africa as a whole produces 25% of its electricity from low-carbon sources, mostly hydro.
Fossil fuels are still the source of almost 60% of the world’s electricity. Coal is the biggest source at 34.4%, followed by gas at 22%.

Thursday 24 April 2025
In just five years, the amount of solar electricity generated in South Africa has increased from 4.9 TWh in 2019 to 19.9 TWh in 2024, according to data from Ember, a global energy think tank.
There’s been a massive increase in solar panel imports to South Africa. In 2023 alone, 4.3GW of solar panels were imported from China, another 3.8GW were imported in 2024.
This is more likely a response to the erratic electricity supply than a burning desire to reduce the country’s carbon emissions, but either way it’s a win for the climate.
Other African countries are also importing solar panels from China to the tune of 12.9GW in 2024. South Africa is far and away the biggest importer, but Nigeria, Morocco and Egypt each imported at least 1GW of solar panel capacity in 2024.

Wednesday 23 April 2025
In South Africa 94% of the population has access to electricity, but many African countries do not generate enough electricity to meet their needs.
The International Energy Agency estimates that in 2023 only about half the population of sub-Saharan African countries had access to electricity, so it’s clear that the amount of electricity generated needs to increase significantly.
Countries like Benin, Botswana, Djibouti, Eswatini, Lesotho, Namibia and Niger, import electricity.
“African countries have immense solar potential and most of it is untapped,” said Dave Jones, Ember’s chief analyst. “Enabling African countries with affordable financing can unleash their solar potential and help provide reliable and secure power supply in the region.”
At present, hydropower is the main source of low-carbon electricity in Africa, generating 17% of the continent’s electricity.
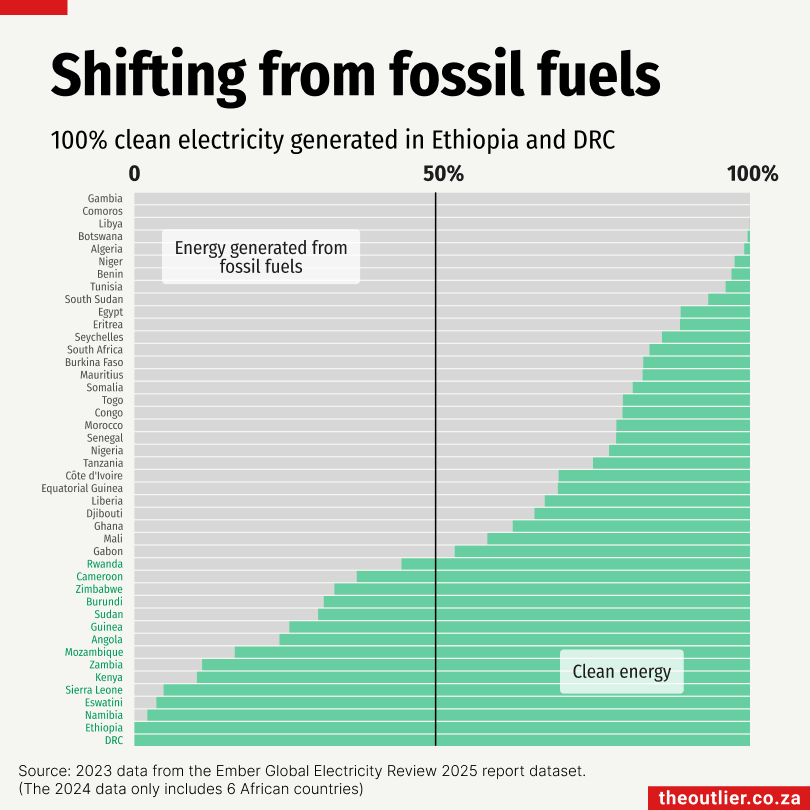
Wednesday 23 April 2025
Ember’s Global Electricity Review 2025 report states that 80 countries generated more than 50% of their electricity from clean sources in 2024.
Although Ember has 2024 data for only six African countries, its 2023 data contains 15 African countries that generated more than half their electricity from clean sources.
The DRC and Ethiopia generate all their electricity from renewable sources, Namibia and Eswatini are close to 100%.
However, a few of those countries also have to import electricity to meet their needs. Namibia, for example, generates its own hydro and solar power, but it has to import around half of its electricity, mainly from South Africa. The same applies to Eswatini.
Hydro is the main clean electricity source in Africa: 19% of the continent’s electricity is hydro.

Wednesday 23 April 2025
In Africa, 25% of the electricity is generated from low-carbon sources, but solar contributes very little – only 4% of the mix in 2024. South Africa generates by far the most solar at 19.9 TWh in 2024, followed by Egypt (5.5 TWh). The Democratic Republic of Congo (DRC) generates the third highest amount of solar electricity (2.2 TWh) but only 2023 data is available.
Hydropower is the main source of low-carbon electricity, generating 17% of the continent’s electricity. In countries like Lesotho, the DRC, Ethiopia, Zambia, Mozambique, Namibia, Malawi, Uganda and Angola, most of the electricity is generated is hydro.
“Though hydropower is a major source of electricity in the region, the increasing frequency of droughts makes it unreliable,” said Dave Jones, Ember’s chief analyst.

Tuesday 22 April 2025
The original concept of Airbnb was for homeowners to make a little extra money from renting out a room or a flatlet on their property, but the opportunity has also created a growing industry of people operating two, 10 or even more rental listings.
In Cape Town a third of properties listed on Airbnb are managed by operators with 10 or more listings, the other two thirds are single listings.
This means, 15,588 of the 25,816 listings in Cape Town are operated by owners with multiple listings. This pattern is common worldwide, except in Paris, where stricter regulations on short-term rentals have altered the landscape.
In Paris, a new cap limiting short-term rentals to 90 days a year instead of the previous 120 days has begun to reshape the Airbnb market.
Similarly, Montreal, Canada, has introduced limits on Airbnb operations, gradually steering operators towards longer-term stays.
The contrast is stark: while 98.6% of Cape Town’s Airbnb rentals are short-term stays, Montreal’s short-term rentals account for only 43.8% of listings.
The data used in this chart can be downloaded from insideairbnb.com

Tuesday 22 April 2025
While the original concept of Airbnb was for homeowners to make a little extra money from renting out a room or a flatlet on their property, the opportunity has also created a growing industry of people operating two, ten or even more rental listings.
In Cape Town a third of properties listed on Airbnb are managed by operators with 10 or more listings.
Two thirds of the listings in Cape Town are single listings.
Or, looked at another way, 15,588 of the 25,816 listings in Cape Town are operated by owners with more than one listing.
In most parts of the world this is the most common pattern, with the exception of Paris where tighter regulations around short-term rentals have switched the pattern.
The data used in this chart can be downloaded from insideairbnb.com

Tuesday 22 April 2025
In Cape Town the city centre and the nearby Seapoint, Camps Bay and Clifton areas are home to the most Airbnb listings in the city. In the CBD there are more than four times the number of listings than in most other areas.
The CBD listings, however, don’t command nearly the same prices as Camps Bay and Clifton listings, and the more affluent suburbs of Bishops Court and Constantia move into the higher price brackets.
Outlying areas closer to Stellenbosch command better prices as the listings attract the country & wine tourists.
There were 25,816 Airbnbs listed in Cape Town in December 2024. This is 2,798 more than in March 2024.
This means Cape Town has roughly the same number of listings as other major cities in the world including Mexico City (26,281) and Tokyo (21,058) and Istanbul (29,400).
The data used in this chart can be downloaded from insideairbnb.com

Tuesday 22 April 2025
In Cape Town the city centre and the nearby Seapoint, Camps Bay and Clifton areas are home to the most Airbnb listings in the city. In the CBD there are more than four times the number of listings than in most other areas.
The CBD listings, however, don’t command nearly the same prices as Camps Bay and Clifton listings, and the more affluent suburbs of Bishops Court and Constantia move into the higher price brackets.
There were 25,816 Airbnbs listed in Cape Town in December 2024. This is 2,798 more than in March 2024. Cape Town has roughly the same number of listings as other major cities in the world including Mexico City (26,281) and Tokyo (21,058) and Istanbul (29,400).
The data used in this chart can be downloaded from insideairbnb.com

Tuesday 22 April 2025
There were 25,816 Airbnbs listed in Cape Town in December 2024. This is 2,798 more than in March 2024 and an increase of more than 5,000 since we first visited this topic in September 2023. At that time there were 20,583 listings.
The city centre and the nearby Seapoint, Camps Bay and Clifton areas are home to the most Airbnb listings in the city. In the CBD there are more than four times the number of listings than in most other areas.
Airbnb operators tend to focus on high-traffic areas closer to the centre of cities which means less rental space is available to those that work in the city, pushing them further out to areas where there is space and more affordable rentals.
But this also often puts additional strain on transport systems to get workers back into the city.
For many city managers the growth in short-term rentals like Airbnb is worrying as it reduces access to long-term housing for residents.
The data used in this chart can be downloaded from insideairbnb.com

Tuesday 22 April 2025
There were 25,816 Airbnbs listed in Cape Town in December 2024.
This means Cape Town has roughly the same number of listings as other major cities in the world including Mexico City (26,281) and Tokyo (21,058) and Istanbul (29,400).
But this number is significantly lower than London, with more than 95,000 listings, and Paris with more than 91,000.
Airbnb has come under fire in many cities around the world because of the rapid growth in listings and particularly the number of multi-listing owners.
For many city managers the growth in short-term rentals like Airbnb is worrying as it reduces access to long-term housing for residents. Airbnb operators also tend to focus on high-traffic areas closer to the centre of cities which means less rental space is available to those that work in the city, pushing them further out to areas where there is space and more affordable rentals.
The data used in the chart can be downloaded from insideairbnb.com

Tuesday 22 April 2025
There were 25,816 Airbnbs listed in Cape Town in December 2024.
This is 2,798 more than in March 2024 and an increase of more than 5,000 since we first visited this topic in September 2023. At that time there were 20,583 listings.
This means Cape Town has roughly the same number of listings as other major cities in the world including Mexico City (26,281), Tokyo (21,058) and Istanbul (29,400).
Airbnb has come under fire in many cities around the world because of the rapid growth in listings and particularly the number of multi-listing owners.
For many city managers the growth in short-term rentals like Airbnb is worrying as it reduces access to long-term housing for residents.
Get the data used in the chart on DataDesk

Thursday 17 April 2025
At the end of 2024, South Africa’s Minister of Basic Education Siviwe Gwarube said her department would eradicate all remaining ‘identified’ pit toilets in schools across the country by 31 March 2025.
The deadline wasn’t met.
On 5 April, Gwarube said they had upgraded the toilet facilities at 96% of the target schools.
The target the minister is speaking about was set after a 2018 audit of school sanitation for an initiative called Sanitation Appropriate for Education (SAFE), which identified 3,375 schools in need of upgrades.
This chart visualises the number of schools with basic pit toilets reported in the Education Facility Management System (EFMS), which is where the Department of Basic Education captures information about school infrastructure. It used to be called the National Education Information Management System (Neims). The latest EFMS report, dated 3 July 2024, lists 287 schools with basic pit latrines as their only toilets in three provinces, Limpopo, KwaZulu-Natal and the Eastern Cape.
See also Pits in 3 provinces
Get the data used in the chart on DataDesk
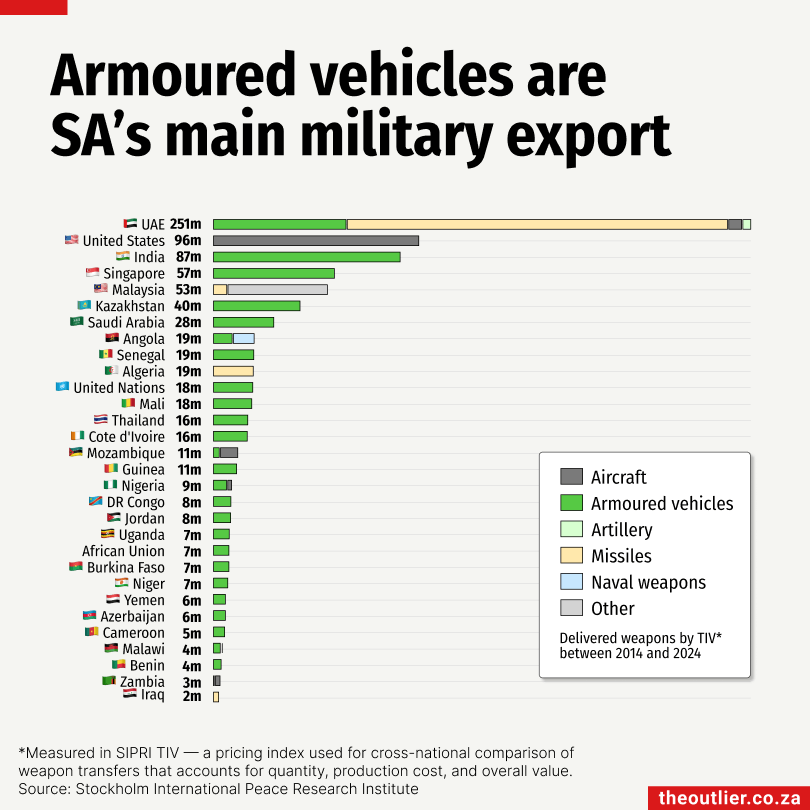
Thursday 3 April 2025
South Africa, the continent’s biggest arms exporting country, specialises in armoured military vehicles.
Private South African companies, such as Paramount, have been largely responsible for the country’s arms export numbers of late, while state-owned Denel has been trying to avoid bankruptcy.
Paramount – a massive South African military technology producer (which moved its headquarters from Sandton to Abu Dhabi) – produces the Maatla, Maurauder, and Mbombe armoured vehicles. More than 600 of these vehicles were sold in the past 10 years to countries including India, Azerbaijan, Kazakhstan, Jordan, Singapore and Mozambique, according to the Stockholm International Peace Institute’s (Sipri’s) arms transfer database.
The Democratic Republic of Congo bought 20 Mbombe-4 and 24 Maatla vehicles from South Africa in 2023.
A smaller South African company, OTT Technologies, sold a number of Puma M-36 armoured vehicles in the past four years: 12 to Benin, 8 to Niger, 18 to Senegal and 24 to the African Union for peacekeeping in Senegal.
Another private company, DCD Protected Mobility sold 79 Springbuck-SD to Cote d’Ivoire.
Get the data used in this chart on DataDesk
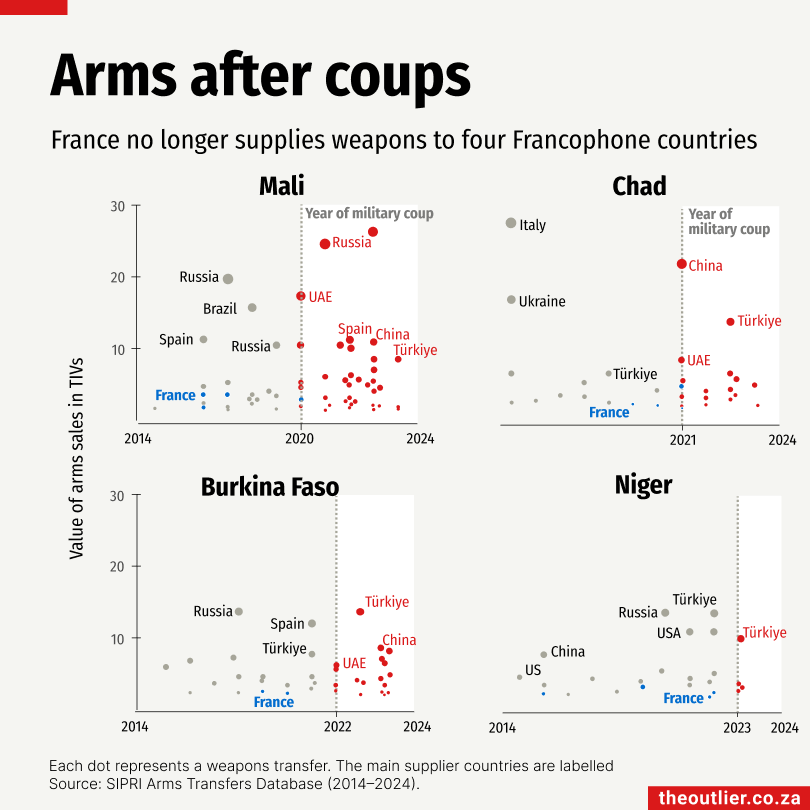
Thursday 3 April 2025
The strong military relationship between France and some African countries is founded on colonial ties, but with increasing anti-French sentiment in former colonies, France is losing some of its market share.
France ranks among the top suppliers of arms to Africa over the past 10 years, particularly because of the volume of military tech it sells to Egypt.
But the historically tight military ties between France and many of its former colonies in Africa have broken down, which can be seen in the arms trade data before and after recent military coups in francophone African countries.
Not only have French troops been expelled (or withdrawn), but many of these countries are no longer buying arms from France. Instead they are buying arms from other African countries, Türkiye, the United Arab Emirates, and China, according to arms transfer data from the Stockholm International Peace Research Institute.
Get the data used in this chart on DataDesk
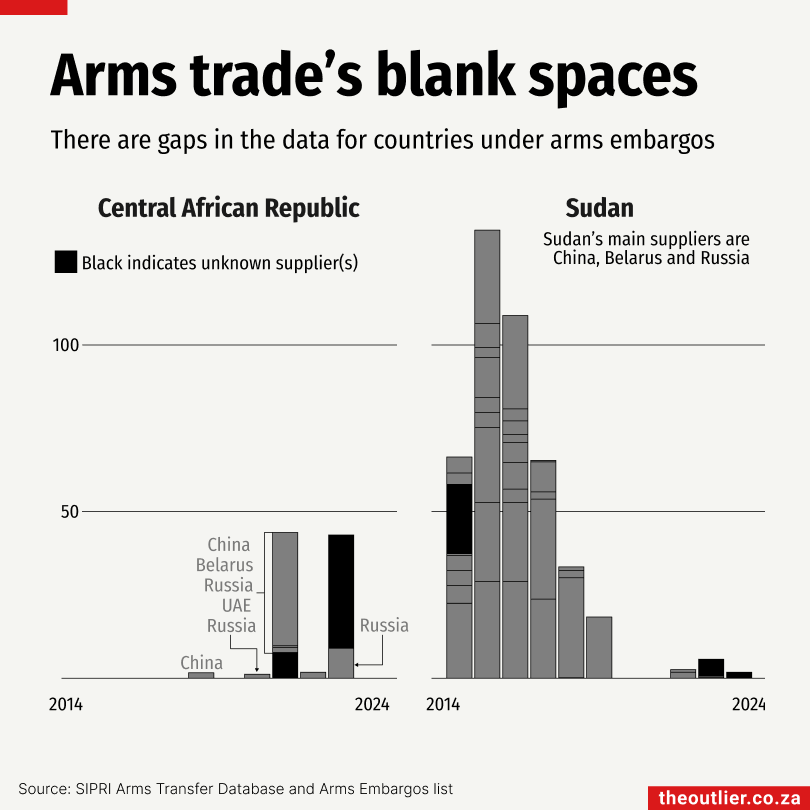
Thursday 3 April 2025
In the past few years there have been armed conflicts in Burkina Faso, the Central African Republic, the Democratic Republic of Congo (DRC), Ethiopia, Mali, Mozambique, Niger, Nigeria, Somalia, South Sudan and Sudan.
Who sells arms to countries in conflict? Someone does, but the data is often murky. The United Nations’ arms embargo on Sudan and the Central African Republic either affects the arms sold to that country or (and this is more likely) affects whether these transactions are documented.
The UN found evidence of arms transferred to areas under embargo like Darfur (Sudan).
For some countries with active conflict the UN issues arms embargoes as a way to mitigate the violence. During these conflicts, arms are often available despite official channels being more heavily monitored, according to data compiled by the Stockholm International Peace Research Institute. Blanks in the data and vague information like ‘unknown supplier’ represent these periods of violent conflict where arms may be available but aren’t being formally traded.
Get the data used in this chart on DataDesk
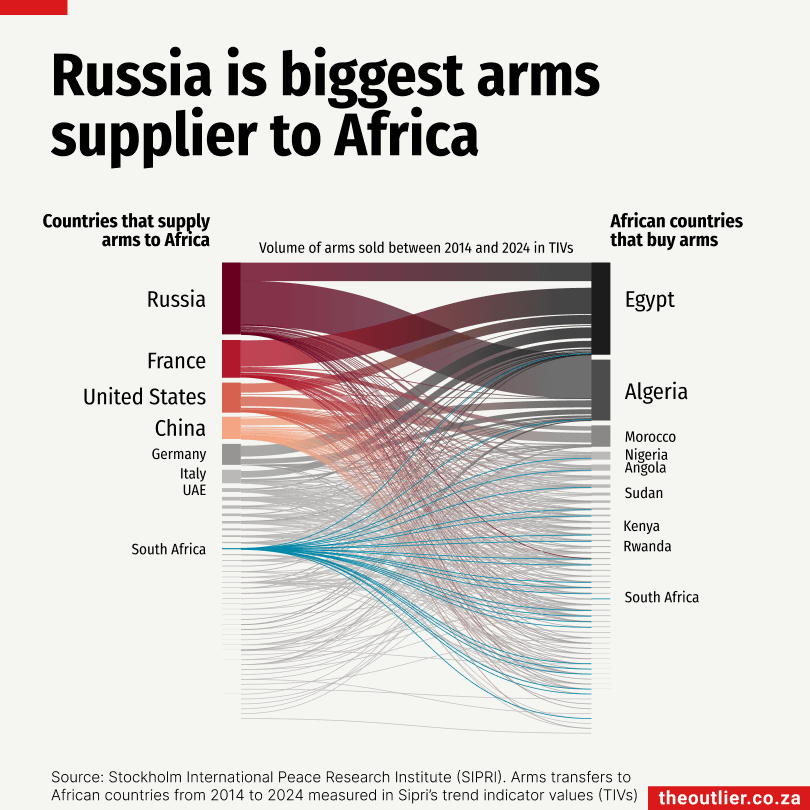
Thursday 3 April 2025
The African arms market is shaped by historical relationships and current politics. Most African countries that buy arms, get them from Russia, France, the United States and China, the global top-four, according to the Stockholm International Peace Research Institute’s (SIPRI’s) arms transfer database.
Although the United States is the world’s largest arms exporter, its exports to Africa are lower in value compared with Russia and France – measured in trend indicator values (TIVs), a system devised by the SIPRI to measure the volume of international transfers of major conventional weapons using a common unit.
Russia, which supplies arms to 23 African countries, exports the most arms by value to Africa. It has deep roots with many of these countries dating back to independence struggles and Cold War-era conflicts.
China, despite transferring less advanced military technology than its competitors, has the widest reach — supplying arms to 36 African countries.
Egypt, Algeria and Morocco account for most of the arms bought by African countries. Between 2014 and 2024, Egypt, Africa’s top weapons buyer, was also the fourth-biggest weapons buyer in the world (surpassed only by Saudi Arabia, India and Qatar) and Algeria ranks 11th.
Get the data used in this chart on DataDesk